

353
particle passing through it and the angular distribution of the scattering are determined by the
particle's size, shape and refractive index, although to a first approximation light scattering
is often regarded as proportional to cell size.
SAMPLE
8lei jWJL
G ~'G ~",cr,,"
go
Profile
• + PLATES
- 0
-
-
80
>
8
8
0
Time
Signal Property
8
8
0
.~
8
8
l~
8
0
8
B
l~_
§
~
Signal II
. .
..
..
. "
Signal II Property
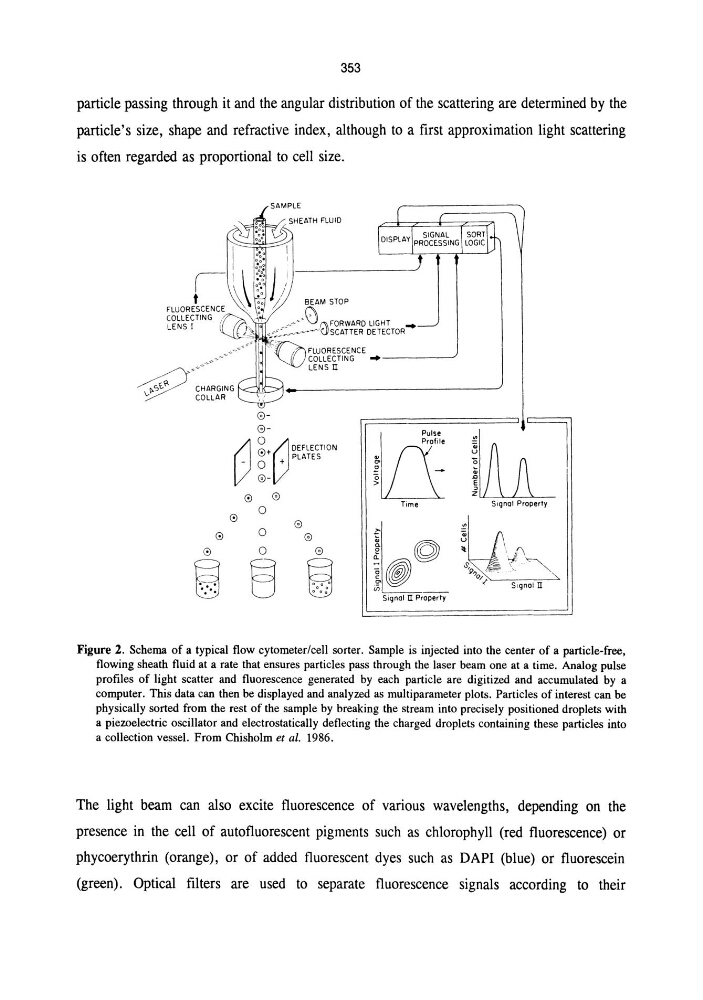
Figure 2. Schema of a typical flow cytometer/cell sorter. Sample is injected into the center of a particle-free.
flowing sheath fluid at a rate that ensures particles pass through the laser beam one at a time. Analog pulse
profiles of light scatter and fluorescence generated by each particle are digitized and accumulated by a
computer. This data can then be displayed and analyzed as multiparameter plots. Particles of interest can be
physically sorted from the rest of the sample by breaking the stream into precisely positioned droplets with
a piezoelectric oscillator and electrostatically deflecting the charged droplets containing these particles into
a collection vessel. From Chisholm et al. 1986.
The light beam can also excite fluorescence of various wavelengths, depending on the
presence in the cell of autofluorescent pigments such as chlorophyll (red fluorescence) or
phycoerythrin (orange), or of added fluorescent dyes such as DAPI (blue) or fluorescein
(green). Optical filters are used to separate fluorescence signals according to their
particle passing through it and the angular distribution of the scattering are determined by the
particle's size, shape and refractive index, although to a first approximation light scattering
is often regarded as proportional to cell size.
SAMPLE
8lei jWJL
G ~'G ~",cr,,"
go
Profile
• + PLATES
- 0
-
-
80
>
8
8
0
Time
Signal Property
8
8
0
.~
8
8
l~
8
0
8
B
l~_
§
~
Signal II
. .
..
..
. "
Signal II Property
Figure 2. Schema of a typical flow cytometer/cell sorter. Sample is injected into the center of a particle-free.
flowing sheath fluid at a rate that ensures particles pass through the laser beam one at a time. Analog pulse
profiles of light scatter and fluorescence generated by each particle are digitized and accumulated by a
computer. This data can then be displayed and analyzed as multiparameter plots. Particles of interest can be
physically sorted from the rest of the sample by breaking the stream into precisely positioned droplets with
a piezoelectric oscillator and electrostatically deflecting the charged droplets containing these particles into
a collection vessel. From Chisholm et al. 1986.
The light beam can also excite fluorescence of various wavelengths, depending on the
presence in the cell of autofluorescent pigments such as chlorophyll (red fluorescence) or
phycoerythrin (orange), or of added fluorescent dyes such as DAPI (blue) or fluorescein
(green). Optical filters are used to separate fluorescence signals according to their