

345
where C1 is the magnitude of the function at 400 nm and C2 is the coefficient defining the
slope of the exponential (0.011 ± 0.002). In order to determine C1, the magnitude of the
curve has to be determined at a wavelength of significant detrital absorption. This method has
been outlined in Roesler et al. (1989). Once detrital absorption is determined, phytoplankton
absorption can be estimated from equation (1).
As already mentioned, the model was applied to data from the Sargasso Sea (Iturriaga and
Siegel, 1989). Figure 1 shows detrital and phytoplankton spectral absorption coefficients from
Biowatt station 04-03 (20m) determined from microphotometric analysis of individual
0.02
0.016
0.012
a [mA-1]
0.008
0.004
o +------+------+------r------r------r----~------400
450
500
550
600
650
700
750
Wavelength [nm]
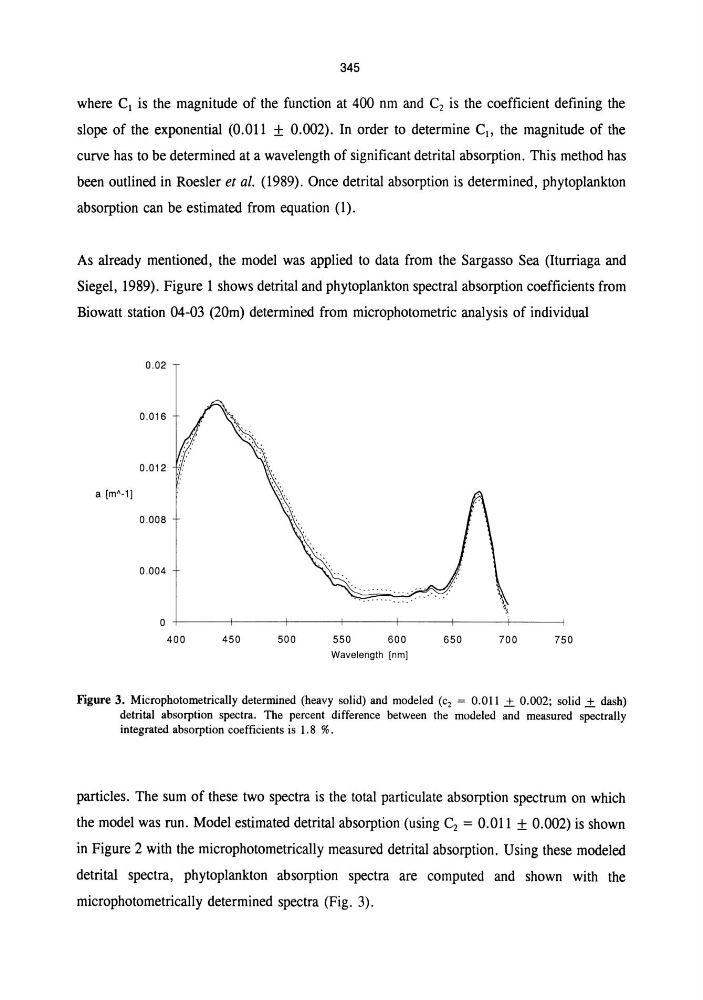
Figure 3. Microphotometrically determined (heavy solid) and modeled (c 2 = 0.011 .± 0.002; solid.± dash)
detrital absorption spectra. The percent difference between the modeled and measured spectrally
integrated absorption coefficients is 1.8 %.
particles. The sum of these two spectra is the total particulate absorption spectrum on which
the model was run. Model estimated detrital absorption (using C 2 = 0.011 ± 0.002) is shown
in Figure 2 with the microphotometrically measured detrital absorption. Using these modeled
detrital spectra, phytoplankton absorption spectra are computed and shown with the
microphotometrically determined spectra (Fig. 3).
where C1 is the magnitude of the function at 400 nm and C2 is the coefficient defining the
slope of the exponential (0.011 ± 0.002). In order to determine C1, the magnitude of the
curve has to be determined at a wavelength of significant detrital absorption. This method has
been outlined in Roesler et al. (1989). Once detrital absorption is determined, phytoplankton
absorption can be estimated from equation (1).
As already mentioned, the model was applied to data from the Sargasso Sea (Iturriaga and
Siegel, 1989). Figure 1 shows detrital and phytoplankton spectral absorption coefficients from
Biowatt station 04-03 (20m) determined from microphotometric analysis of individual
0.02
0.016
0.012
a [mA-1]
0.008
0.004
o +------+------+------r------r------r----~------400
450
500
550
600
650
700
750
Wavelength [nm]
Figure 3. Microphotometrically determined (heavy solid) and modeled (c 2 = 0.011 .± 0.002; solid.± dash)
detrital absorption spectra. The percent difference between the modeled and measured spectrally
integrated absorption coefficients is 1.8 %.
particles. The sum of these two spectra is the total particulate absorption spectrum on which
the model was run. Model estimated detrital absorption (using C 2 = 0.011 ± 0.002) is shown
in Figure 2 with the microphotometrically measured detrital absorption. Using these modeled
detrital spectra, phytoplankton absorption spectra are computed and shown with the
microphotometrically determined spectra (Fig. 3).