

344
analysis of field samples has proven useful in characterizing the variability in absorption
efficiency between individual particles for both viable phytoplankton and non-living detrital
material.
An alternate way to partition the total particulate absorption into the phytoplankton and detrital
components is to make a supplementary spectrophotometric measurement on a filter pad after
extraction treatment in organic solvent (Kishino et al., 1985). Assuming that all pigments
associated with viable phytoplankton are removed by extraction, the phytoplankton component
is obtained as a difference between the values that had been measured before and after
extraction. The drawback of such a method is that non-extractable algal pigments (Phycobilins,
cytochromes) and bleached cells contribute to the estimate of detrital absorption. In addition,
some pigments present in detritus are extracted; hence they contribute to the estimate of
absorption by viable phytoplankton.
Given the fact that none of the present techniques for measuring the absorption of field
samples is ideal, they must rather be regarded as complementary. A comparison of
microphotometric and bulk filter pad data is desirable. Such initial comparisons show that the
spectral shape and magnitude of absorption efficiency derived from both methods agree
favourably for laboratory cultures of phytoplankton and natural samples (Iturriaga and Siegel,
1988).Another interesting exercise is to apply a partitioning model for the total particulate
absorption based upon bulk spectrophotometric analysis and compare the results with the data
representing individual phytoplankton and detrital particles. An example is provided by Collin
Roesler using the model described in Roesler et al. (1989) and absorption data collected in
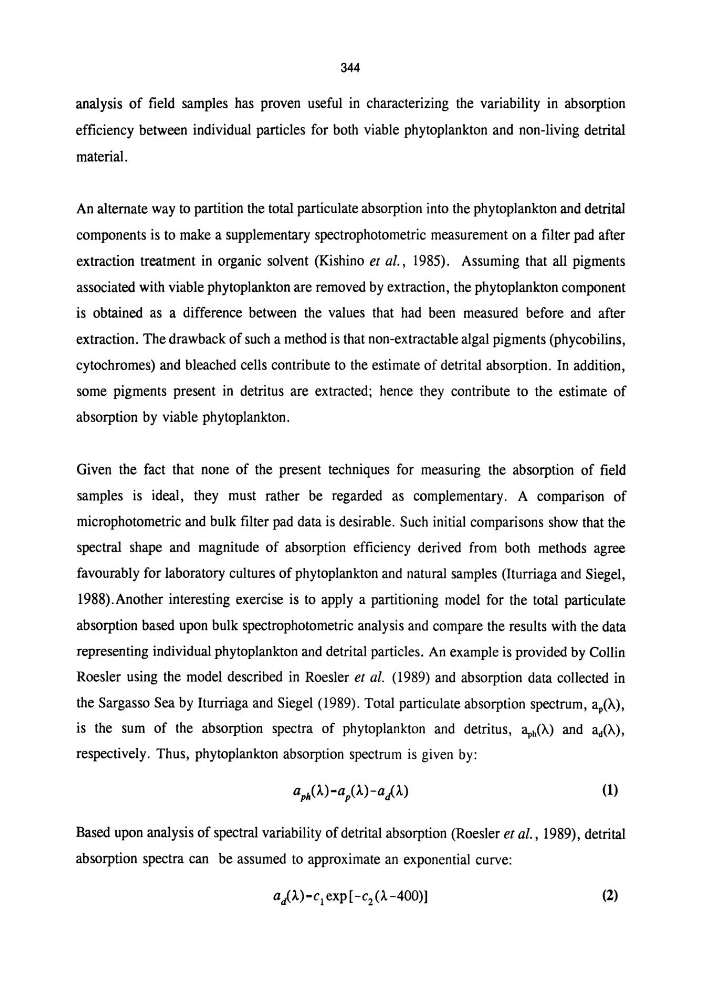
the Sargasso Sea by Iturriaga and Siegel (1989). Total particulate absorption spectrum, a p (}.),
is the sum of the absorption spectra of phytoplankton and detritus, ~h(}.) and ll.!(}.) ,
respectively. Thus, phytoplankton absorption spectrum is given by:
(1)
Based upon analysis of spectral variability of detrital absorption (Roesler et al., 1989), detrital
absorption spectra can be assumed to approximate an exponential curve:
(2)
analysis of field samples has proven useful in characterizing the variability in absorption
efficiency between individual particles for both viable phytoplankton and non-living detrital
material.
An alternate way to partition the total particulate absorption into the phytoplankton and detrital
components is to make a supplementary spectrophotometric measurement on a filter pad after
extraction treatment in organic solvent (Kishino et al., 1985). Assuming that all pigments
associated with viable phytoplankton are removed by extraction, the phytoplankton component
is obtained as a difference between the values that had been measured before and after
extraction. The drawback of such a method is that non-extractable algal pigments (Phycobilins,
cytochromes) and bleached cells contribute to the estimate of detrital absorption. In addition,
some pigments present in detritus are extracted; hence they contribute to the estimate of
absorption by viable phytoplankton.
Given the fact that none of the present techniques for measuring the absorption of field
samples is ideal, they must rather be regarded as complementary. A comparison of
microphotometric and bulk filter pad data is desirable. Such initial comparisons show that the
spectral shape and magnitude of absorption efficiency derived from both methods agree
favourably for laboratory cultures of phytoplankton and natural samples (Iturriaga and Siegel,
1988).Another interesting exercise is to apply a partitioning model for the total particulate
absorption based upon bulk spectrophotometric analysis and compare the results with the data
representing individual phytoplankton and detrital particles. An example is provided by Collin
Roesler using the model described in Roesler et al. (1989) and absorption data collected in
the Sargasso Sea by Iturriaga and Siegel (1989). Total particulate absorption spectrum, a p (}.),
is the sum of the absorption spectra of phytoplankton and detritus, ~h(}.) and ll.!(}.) ,
respectively. Thus, phytoplankton absorption spectrum is given by:
(1)
Based upon analysis of spectral variability of detrital absorption (Roesler et al., 1989), detrital
absorption spectra can be assumed to approximate an exponential curve:
(2)