

343
0.012
0.009
a [m'-1] 0.006
1
0003
1
o ~-----r-----+------~----~-----+-----4----~
400
450
500
550
600
650
700
750
Wavelength [nm]
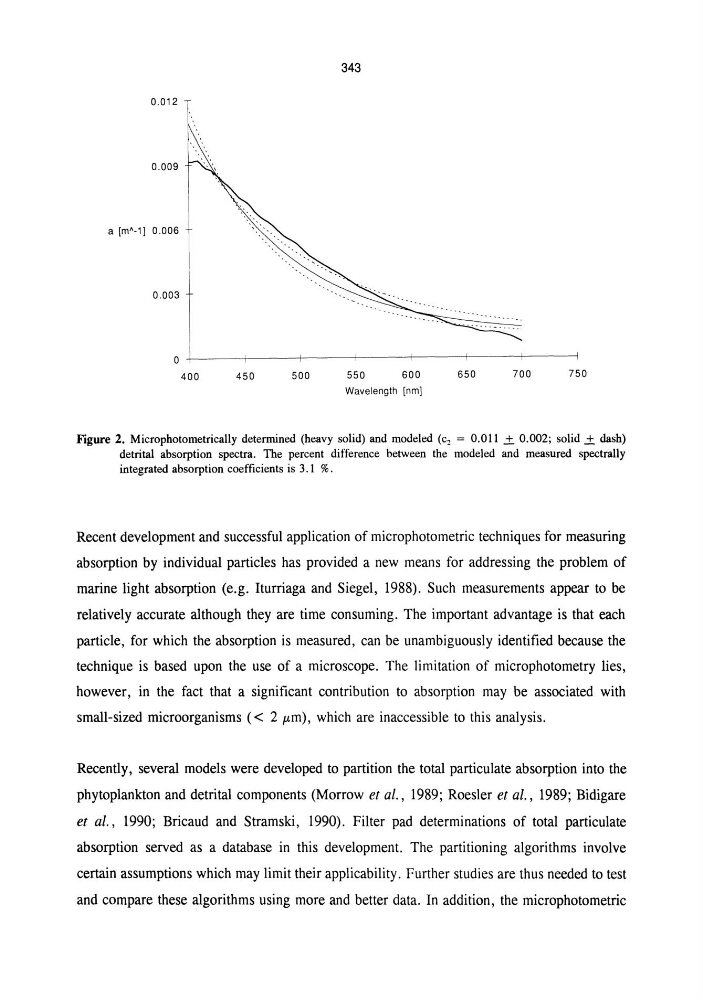
Figure 2. Microphotometrically determined (heavy solid) and modeled (c2 = 0.011 .± 0.002; solid.± dash)
detrital absorption spectra. The percent difference between the modeled and measured spectrally
integrated absorption coefficients is 3. 1 %.
Recent development and successful application of microphotometric techniques for measuring
absorption by individual particles has provided a new means for addressing the problem of
marine light absorption (e.g_ Iturriaga and Siegel, 1988). Such measurements appear to be
relatively accurate although they are time consuming. The important advantage is that each
particle, for which the absorption is measured, can be unambiguously identified because the
technique is based upon the use of a microscope. The limitation of microphotometry lies,
however, in the fact that a significant contribution to absorption may be associated with
small-sized microorganisms « 2 /Lm), which are inaccessible to this analysis.
Recently, several models were developed to partition the total particulate absorption into the
phytoplankton and detrital components (Morrow et al., 1989; Roesler et al., 1989; Bidigare
et al., 1990; Bricaud and Stramski, 1990). Filter pad determinations of total particulate
absorption served as a database in this development. The partitioning algorithms involve
certain assumptions which may limit their applicability. Further studies are thus needed to test
and compare these algorithms using more and better data. In addition, the microphotometric
0.012
0.009
a [m'-1] 0.006
1
0003
1
o ~-----r-----+------~----~-----+-----4----~
400
450
500
550
600
650
700
750
Wavelength [nm]
Figure 2. Microphotometrically determined (heavy solid) and modeled (c2 = 0.011 .± 0.002; solid.± dash)
detrital absorption spectra. The percent difference between the modeled and measured spectrally
integrated absorption coefficients is 3. 1 %.
Recent development and successful application of microphotometric techniques for measuring
absorption by individual particles has provided a new means for addressing the problem of
marine light absorption (e.g_ Iturriaga and Siegel, 1988). Such measurements appear to be
relatively accurate although they are time consuming. The important advantage is that each
particle, for which the absorption is measured, can be unambiguously identified because the
technique is based upon the use of a microscope. The limitation of microphotometry lies,
however, in the fact that a significant contribution to absorption may be associated with
small-sized microorganisms « 2 /Lm), which are inaccessible to this analysis.
Recently, several models were developed to partition the total particulate absorption into the
phytoplankton and detrital components (Morrow et al., 1989; Roesler et al., 1989; Bidigare
et al., 1990; Bricaud and Stramski, 1990). Filter pad determinations of total particulate
absorption served as a database in this development. The partitioning algorithms involve
certain assumptions which may limit their applicability. Further studies are thus needed to test
and compare these algorithms using more and better data. In addition, the microphotometric