

8
DERIVATION OF AIR SEA FLUXES BY PARAMETERISATIONS
70
---- WMO
60
Kau feld :0 m
C 50
.:,,:
~ 10
Q)
0..
C/) 30
-0
C
~ 20 r
10
o
o I 2 3
4
5
6
7
8
9 10 It 12
Rf>flllfor t
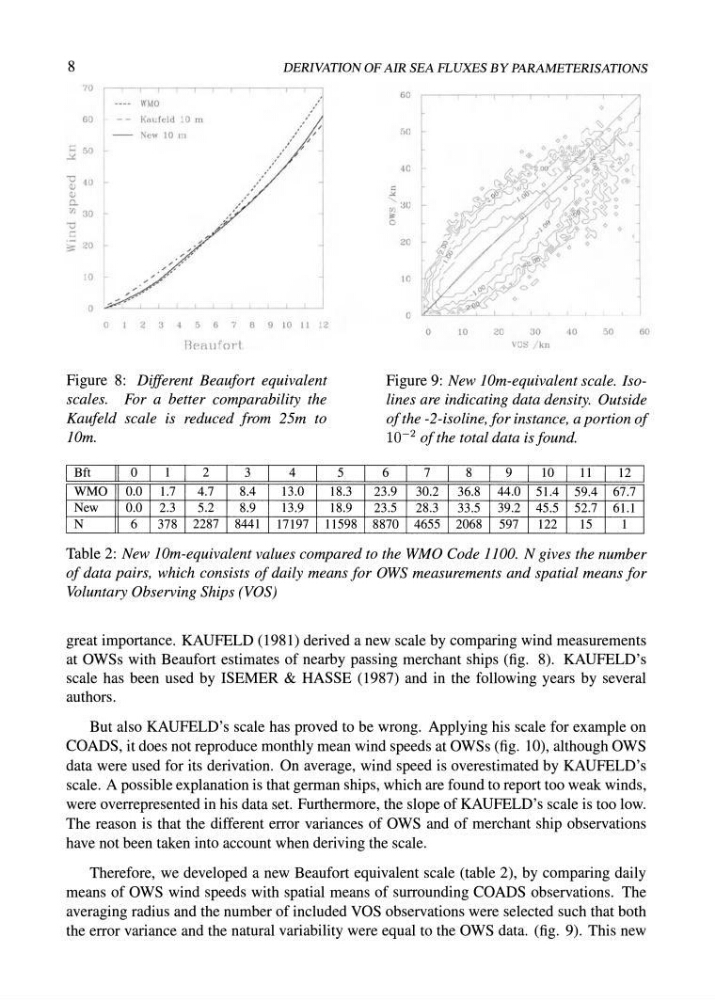
Figure 8: Different Beaufort equivalent
scales. For a better comparability the
Kaufeld scale is reduced from 25m to
10m.
1 Bft
o
2
3
4
WMO
0.0
1.7
4.7
8.4
13.0
New
0.0 2.3
5.2
8.9
13.9
5
18.3
18.9
N
6
378 2287 8441
17197 11598
60
2C
Ie
o
o
10
20
30
lie' I kn
40
50
60
Figure 9: New 10m-equivalent scale. Isolines are indicating data density. Outside
of the -2-isoline, for instance, a portion of
10- 2 of the total data is found.
6
7
819110111 12
23.9
30.2
36.8 44.0 51.4 59.4 67.7
23.5
28.3
33.5 39.2 45 .5 52.7 61.1
8870 4655 2068 597
122
15
1
Table 2: New 10m-equivalent values compared to the WMO Code 1100. N gives the number
of data pairs, which consists of daily means for ows measurements and spatial means for
Voluntary Observing Ships (VOS)
great importance. KAUFELD (1981) derived a new scale by comparing wind measurements
at OWSs with Beaufort estimates of nearby passing merchant ships (fig. 8). KAUFELD's
scale has been used by ISEMER & HASSE (1987) and in the following years by several
authors.
But also KAUFELD's scale has proved to be wrong. Applying his scale for example on
COADS, it does not reproduce monthly mean wind speeds at OWSs (fig. 10), although OWS
data were used for its derivation. On average, wind speed is overestimated by KAUFELD's
scale. A possible explanation is that german ships, which are found to report too weak winds,
were overrepresented in his data set. Furthermore, the slope of KAUFELD's scale is too low.
The reason is that the different error variances of OWS and of merchant ship observations
have not been taken into account when deriving the scale.
Therefore, we developed a new Beaufort equivalent scale (table 2), by comparing daily
means of OWS wind speeds with spatial means of surrounding COADS observations. The
averaging radius and the number of included VOS observations were selected such that both
the error variance and the natural variability were equal to the OWS data. (fig. 9). This new
DERIVATION OF AIR SEA FLUXES BY PARAMETERISATIONS
70
---- WMO
60
Kau feld :0 m
C 50
.:,,:
~ 10
Q)
0..
C/) 30
-0
C
~ 20 r
10
o
o I 2 3
4
5
6
7
8
9 10 It 12
Rf>flllfor t
Figure 8: Different Beaufort equivalent
scales. For a better comparability the
Kaufeld scale is reduced from 25m to
10m.
1 Bft
o
2
3
4
WMO
0.0
1.7
4.7
8.4
13.0
New
0.0 2.3
5.2
8.9
13.9
5
18.3
18.9
N
6
378 2287 8441
17197 11598
60
2C
Ie
o
o
10
20
30
lie' I kn
40
50
60
Figure 9: New 10m-equivalent scale. Isolines are indicating data density. Outside
of the -2-isoline, for instance, a portion of
10- 2 of the total data is found.
6
7
819110111 12
23.9
30.2
36.8 44.0 51.4 59.4 67.7
23.5
28.3
33.5 39.2 45 .5 52.7 61.1
8870 4655 2068 597
122
15
1
Table 2: New 10m-equivalent values compared to the WMO Code 1100. N gives the number
of data pairs, which consists of daily means for ows measurements and spatial means for
Voluntary Observing Ships (VOS)
great importance. KAUFELD (1981) derived a new scale by comparing wind measurements
at OWSs with Beaufort estimates of nearby passing merchant ships (fig. 8). KAUFELD's
scale has been used by ISEMER & HASSE (1987) and in the following years by several
authors.
But also KAUFELD's scale has proved to be wrong. Applying his scale for example on
COADS, it does not reproduce monthly mean wind speeds at OWSs (fig. 10), although OWS
data were used for its derivation. On average, wind speed is overestimated by KAUFELD's
scale. A possible explanation is that german ships, which are found to report too weak winds,
were overrepresented in his data set. Furthermore, the slope of KAUFELD's scale is too low.
The reason is that the different error variances of OWS and of merchant ship observations
have not been taken into account when deriving the scale.
Therefore, we developed a new Beaufort equivalent scale (table 2), by comparing daily
means of OWS wind speeds with spatial means of surrounding COADS observations. The
averaging radius and the number of included VOS observations were selected such that both
the error variance and the natural variability were equal to the OWS data. (fig. 9). This new