

LATENT AND SENSIBLE HEAT FLUXES
7
1.0
1.0
0.8
0.8
0.6
P
0.6
C
C
T
u;
0.4
[J)
0.4
' "
VE
' "
c
0235 ~ ~
~ L ~ J ~ ~~~~N-~
0
0.2
J
0.2
' "
~~~~t\.~~
I
#J
[J)
p
OC
E
T
+-'
+-'
0.0
- - - - - - - -- - - - - - - -0.0 0.00<> - - - ~ A ~ ~ r
~ --- - ~ - -
M
V
~-0.2
~-0.2
L
D
N
:>
:>
B M
"'-0.4
'::;-0.4
-'
-0.6
-0.6
-0.8
-0.8
-1.0
-1.0
0
10
20
30
0
10
20
30
tw vas
ts vas
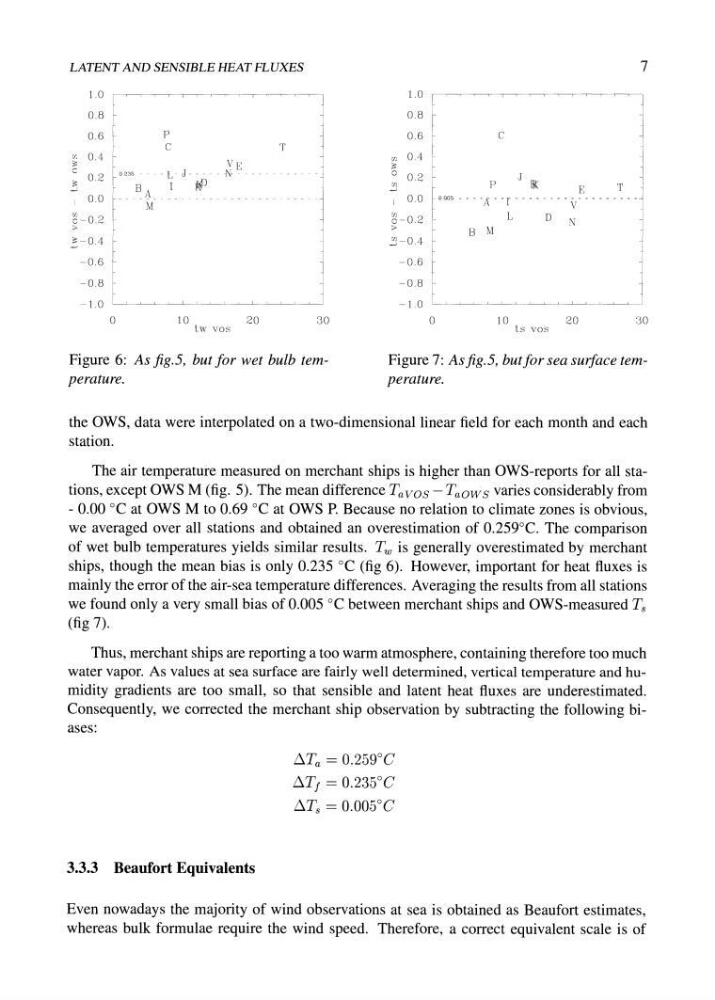
Figure 6: As fig. 5, but for wet bulb temperature.
Figure 7: Asfig.5, butfor sea suiface temperature.
the OWS, data were interpolated on a two-dimensional linear field for each month and each
station.
The air temperature measured on merchant ships is higher than OWS-reports for all stations, except OWS M (fig. 5). The mean difference Tavos - TaOws varies considerably from
- 0.00 °C at OWS M to 0.69 °C at OWS P. Because no relation to climate zones is obvious,
we averaged over all stations and obtained an overestimation of 0.259°C. The comparison
of wet bulb temperatures yields similar results. Tw is generally overestimated by merchant
ships, though the mean bias is only 0.235 °C (fig 6). However, important for heat fluxes is
mainly the error of the air-sea temperature differences. Averaging the results from all stations
we found only a very small bias of 0.005 °C between merchant ships and OWS-measured Ts
(fig 7).
Thus, merchant ships are reporting a too warm atmosphere, containing therefore too much
water vapor. As values at sea surface are fairly well determined, vertical temperature and humidity gradients are too small, so that sensible and latent heat fluxes are underestimated.
Consequently, we corrected the merchant ship observation by subtracting the following biases:
3.3.3 Beaufort Equivalents
!:1Ta = 0.259°C
!:1T j = 0_235°C
!:1Ts = 0.005°C
Even nowadays the majority of wind observations at sea is obtained as Beaufort estimates,
whereas bulk formulae require the wind speed. Therefore, a correct equivalent scale is of
7
1.0
1.0
0.8
0.8
0.6
P
0.6
C
C
T
u;
0.4
[J)
0.4
' "
VE
' "
c
0235 ~ ~
~ L ~ J ~ ~~~~N-~
0
0.2
J
0.2
' "
~~~~t\.~~
I
#J
[J)
p
OC
E
T
+-'
+-'
0.0
- - - - - - - -- - - - - - - -0.0 0.00<> - - - ~ A ~ ~ r
~ --- - ~ - -
M
V
~-0.2
~-0.2
L
D
N
:>
:>
B M
"'-0.4
'::;-0.4
-'
-0.6
-0.6
-0.8
-0.8
-1.0
-1.0
0
10
20
30
0
10
20
30
tw vas
ts vas
Figure 6: As fig. 5, but for wet bulb temperature.
Figure 7: Asfig.5, butfor sea suiface temperature.
the OWS, data were interpolated on a two-dimensional linear field for each month and each
station.
The air temperature measured on merchant ships is higher than OWS-reports for all stations, except OWS M (fig. 5). The mean difference Tavos - TaOws varies considerably from
- 0.00 °C at OWS M to 0.69 °C at OWS P. Because no relation to climate zones is obvious,
we averaged over all stations and obtained an overestimation of 0.259°C. The comparison
of wet bulb temperatures yields similar results. Tw is generally overestimated by merchant
ships, though the mean bias is only 0.235 °C (fig 6). However, important for heat fluxes is
mainly the error of the air-sea temperature differences. Averaging the results from all stations
we found only a very small bias of 0.005 °C between merchant ships and OWS-measured Ts
(fig 7).
Thus, merchant ships are reporting a too warm atmosphere, containing therefore too much
water vapor. As values at sea surface are fairly well determined, vertical temperature and humidity gradients are too small, so that sensible and latent heat fluxes are underestimated.
Consequently, we corrected the merchant ship observation by subtracting the following biases:
3.3.3 Beaufort Equivalents
!:1Ta = 0.259°C
!:1T j = 0_235°C
!:1Ts = 0.005°C
Even nowadays the majority of wind observations at sea is obtained as Beaufort estimates,
whereas bulk formulae require the wind speed. Therefore, a correct equivalent scale is of