

29. VEGETATION: AN EARTH OBSERVATION SYSTEM TO
MONITOR THE BIOSPHERE
297
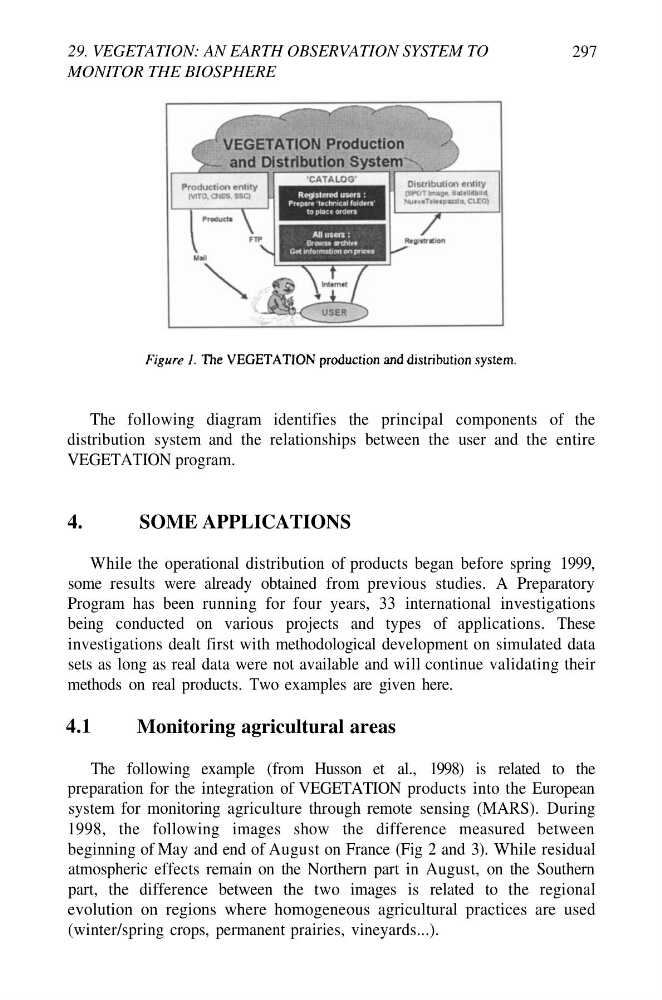
The following diagram identifies the principal components of the
distribution system and the relationships between the user and the entire
VEGETATION program.
4.
SOME APPLICATIONS
While the operational distribution of products began before spring 1999,
some results were already obtained from previous studies. A Preparatory
Program has been running for four years, 33 international investigations
being conducted on various projects and types of applications. These
investigations dealt first with methodological development on simulated data
sets as long as real data were not available and will continue validating their
methods on real products. Two examples are given here.
Monitoring agricultural areas
The following example (from Husson et al., 1998) is related to the
preparation for the integration of VEGETATION products into the European
system for monitoring agriculture through remote sensing (MARS). During
1998, the following images show the difference measured between
beginning of May and end of August on France (Fig 2 and 3). While residual
atmospheric effects remain on the Northern part in August, on the Southern
part, the difference between the two images is related to the regional
evolution on regions where homogeneous agricultural practices are used
(winter/spring crops, permanent prairies, vineyards...).
4.1
MONITOR THE BIOSPHERE
297
The following diagram identifies the principal components of the
distribution system and the relationships between the user and the entire
VEGETATION program.
4.
SOME APPLICATIONS
While the operational distribution of products began before spring 1999,
some results were already obtained from previous studies. A Preparatory
Program has been running for four years, 33 international investigations
being conducted on various projects and types of applications. These
investigations dealt first with methodological development on simulated data
sets as long as real data were not available and will continue validating their
methods on real products. Two examples are given here.
Monitoring agricultural areas
The following example (from Husson et al., 1998) is related to the
preparation for the integration of VEGETATION products into the European
system for monitoring agriculture through remote sensing (MARS). During
1998, the following images show the difference measured between
beginning of May and end of August on France (Fig 2 and 3). While residual
atmospheric effects remain on the Northern part in August, on the Southern
part, the difference between the two images is related to the regional
evolution on regions where homogeneous agricultural practices are used
(winter/spring crops, permanent prairies, vineyards...).
4.1