

298
Chapter 29
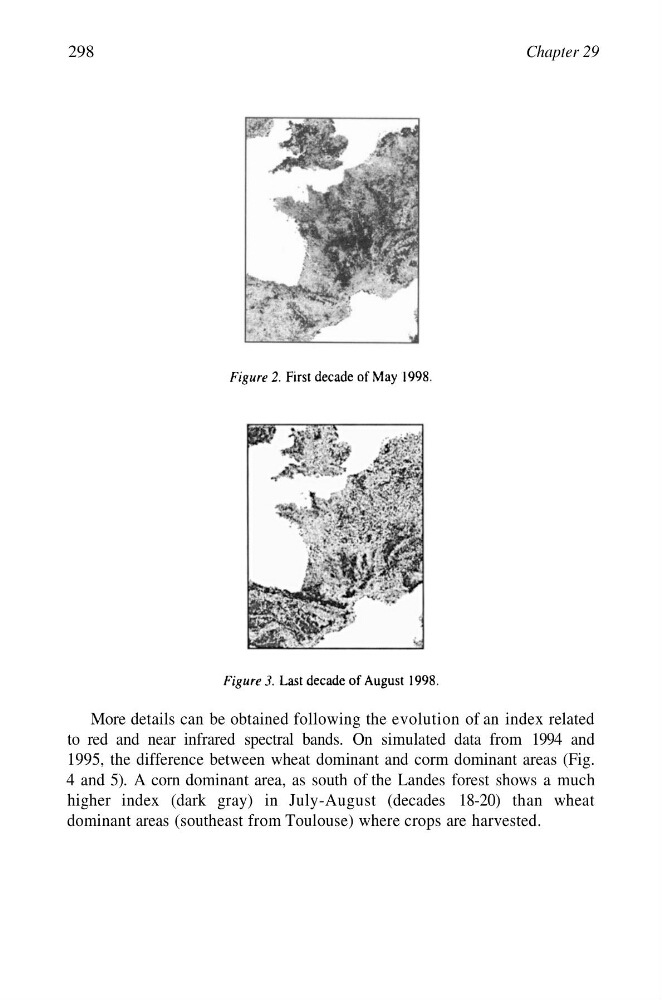
More details can be obtained following the evolution of an index related
to red and near infrared spectral bands. On simulated data from 1994 and
1995, the difference between wheat dominant and corm dominant areas (Fig.
4 and 5). A corn dominant area, as south of the Landes forest shows a much
higher index (dark gray) in July-August (decades 18-20) than wheat
dominant areas (southeast from Toulouse) where crops are harvested.
Chapter 29
More details can be obtained following the evolution of an index related
to red and near infrared spectral bands. On simulated data from 1994 and
1995, the difference between wheat dominant and corm dominant areas (Fig.
4 and 5). A corn dominant area, as south of the Landes forest shows a much
higher index (dark gray) in July-August (decades 18-20) than wheat
dominant areas (southeast from Toulouse) where crops are harvested.