

76
2: Raghuveer M. Rao, Manoj K. Arora
2.6.5
Classification Accuracy Assessment
Accuracy assessment is an essential component of an image classification.
A typical strategy to assess the accuracy of a crisp classification begins with
the selection of a sample of pixels (known as testing samples) in the classified
image based on a sampling design procedure (Stehman 1999), and verifying
their class allocation from the reference data. The pixels of agreement and
disagreement are summarized in the form of a contingency table (known as
error or confusion matrix), which can be used to estimate various accuracy
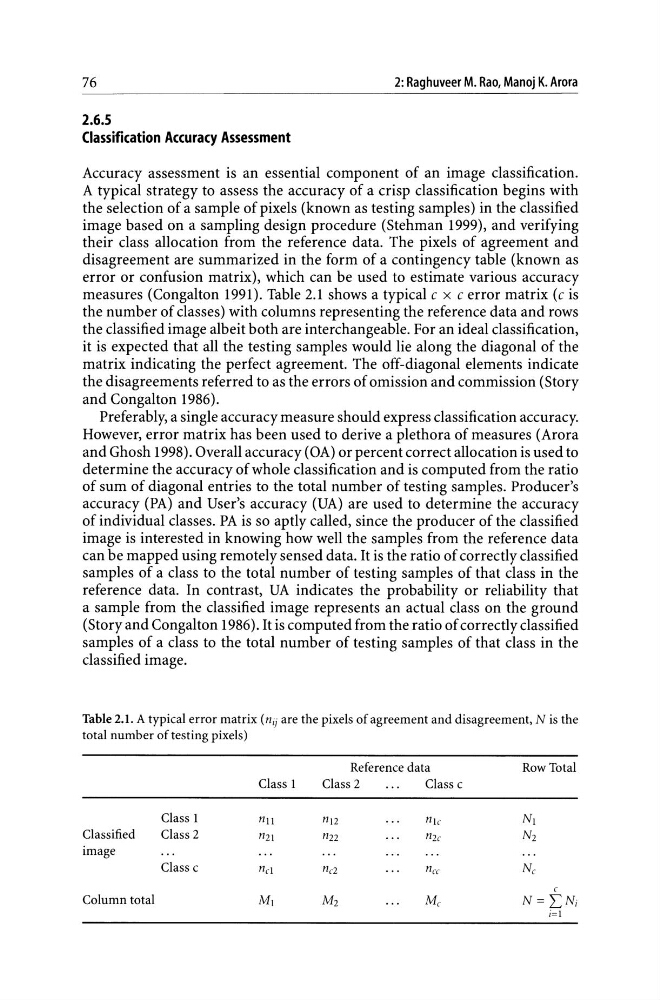
measures (Congalton 1991). Table 2.1 shows a typical c x c error matrix (c is
the number of classes) with columns representing the reference data and rows
the classified image albeit both are interchangeable. For an ideal classification,
it is expected that all the testing samples would lie along the diagonal of the
matrix indicating the perfect agreement. The off-diagonal elements indicate
the disagreements referred to as the errors of omission and commission (Story
and Congalton 1986).
Preferably, a single accuracy measure should express classification accuracy.
However, error matrix has been used to derive a plethora of measures (Arora
and Ghosh 1998). Overall accuracy (OA) or percent correct allocation is used to
determine the accuracy of whole classification and is computed from the ratio
of sum of diagonal entries to the total number of testing samples. Producer's
accuracy (PA) and User's accuracy (UA) are used to determine the accuracy
of individual classes. PA is so aptly called, since the producer of the classified
image is interested in knowing how well the samples from the reference data
can be mapped using remotely sensed data. It is the ratio of correctly classified
samples of a class to the total number of testing samples of that class in the
reference data. In contrast, UA indicates the probability or reliability that
a sample from the classified image represents an actual class on the ground
(Story and Congalton 1986). It is computed from the ratio of correctly classified
samples of a class to the total number of testing samples of that class in the
classified image.
Table 2.1. A typical error matrix (nij are the pixels of agreement and disagreement, N is the
total number of testing pixels)
Reference data
Row Total
Class 1
Class 2
Class c
Class 1
nll
nJ2
nle
NI
Classified
Class 2
n21
n22
n2e
N2
image
Class c
ncl
n c2
nee
Ne
c
Column total
MI
M2
Me
N=I:Ni
i=1
2: Raghuveer M. Rao, Manoj K. Arora
2.6.5
Classification Accuracy Assessment
Accuracy assessment is an essential component of an image classification.
A typical strategy to assess the accuracy of a crisp classification begins with
the selection of a sample of pixels (known as testing samples) in the classified
image based on a sampling design procedure (Stehman 1999), and verifying
their class allocation from the reference data. The pixels of agreement and
disagreement are summarized in the form of a contingency table (known as
error or confusion matrix), which can be used to estimate various accuracy
measures (Congalton 1991). Table 2.1 shows a typical c x c error matrix (c is
the number of classes) with columns representing the reference data and rows
the classified image albeit both are interchangeable. For an ideal classification,
it is expected that all the testing samples would lie along the diagonal of the
matrix indicating the perfect agreement. The off-diagonal elements indicate
the disagreements referred to as the errors of omission and commission (Story
and Congalton 1986).
Preferably, a single accuracy measure should express classification accuracy.
However, error matrix has been used to derive a plethora of measures (Arora
and Ghosh 1998). Overall accuracy (OA) or percent correct allocation is used to
determine the accuracy of whole classification and is computed from the ratio
of sum of diagonal entries to the total number of testing samples. Producer's
accuracy (PA) and User's accuracy (UA) are used to determine the accuracy
of individual classes. PA is so aptly called, since the producer of the classified
image is interested in knowing how well the samples from the reference data
can be mapped using remotely sensed data. It is the ratio of correctly classified
samples of a class to the total number of testing samples of that class in the
reference data. In contrast, UA indicates the probability or reliability that
a sample from the classified image represents an actual class on the ground
(Story and Congalton 1986). It is computed from the ratio of correctly classified
samples of a class to the total number of testing samples of that class in the
classified image.
Table 2.1. A typical error matrix (nij are the pixels of agreement and disagreement, N is the
total number of testing pixels)
Reference data
Row Total
Class 1
Class 2
Class c
Class 1
nll
nJ2
nle
NI
Classified
Class 2
n21
n22
n2e
N2
image
Class c
ncl
n c2
nee
Ne
c
Column total
MI
M2
Me
N=I:Ni
i=1