

Overview of Image Processing
75
determine the class composition of a mixed pixel is linear mixture modeling
{LMM}, also referred to as spectral mixture analysis {Settle and Drake 1993}.
The objective of mixture modeling is to unmix the classes that are identifiable
at some finer spatial scale. It is based on the assumption that the spectral
response of an individual pixel is the linear sum of the spectral responses of
the component classes of the pixels weighted by their relative proportions. The
details on LMM algorithm can be found in Settle and Drake {1993}.
However, to adopt fuzzy classification outputs from either MLC or LMM, the
data need to satisfy statistical distribution assumptions, which as discussed
before are often untenable. Alternative methods such as fuzzy set and neural
network based classification, which are non-parametric in nature, may be more
appropriate. Besides providing crisp classification outputs, these approaches
may also be used to extract information at sub-pixel level. For instance, class
membership values from the most widely used fuzzy c-means {FCM} clustering
{described briefly here} and the activation levels of the output unit of a neural
network may be used to represent the class composition of a mixed pixel
{Foody and Arora 1996}.
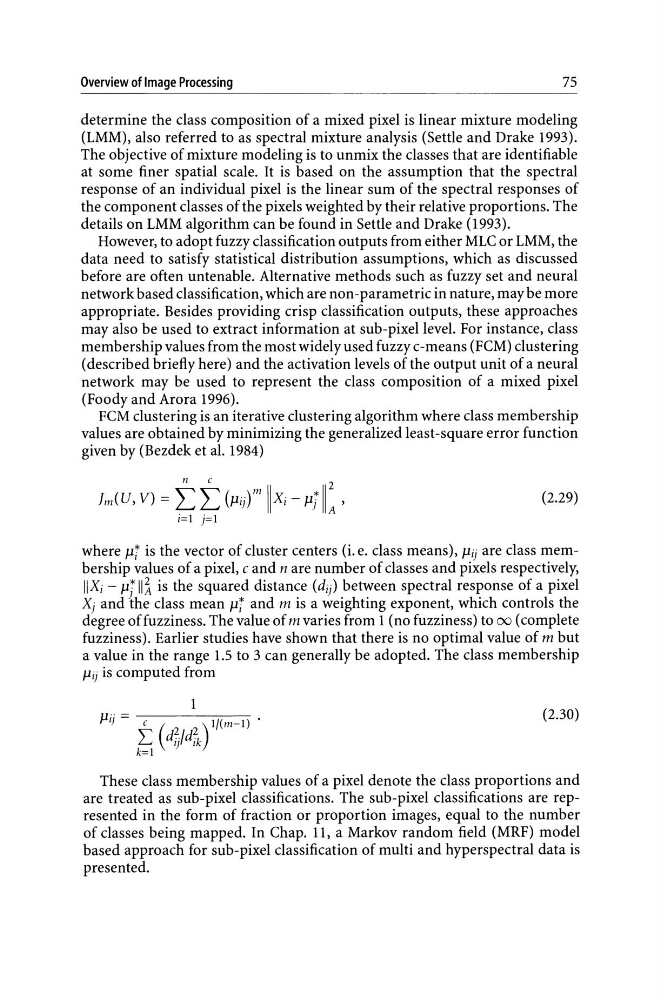
FCM clustering is an iterative clustering algorithm where class membership
values are obtained by minimizing the generalized least -square error function
given by {Bezdek et al. 1984}
{2.29}
where pi is the vector of cluster centers {i. e. class means}, Pij are class membership values of a pixel, c and n are number of classes and pixels respectively,
IIXi - pj II~ is the squared distance {dij} between spectral response of a pixel
Xj and the class mean pi and m is a weighting exponent, which controls the
degree of fuzziness. The value of m varies from 1 {no fuzziness} to 00 {complete
fuzziness}. Earlier studies have shown that there is no optimal value of m but
a value in the range 1.5 to 3 can generally be adopted. The class membership
Pij is computed from
1
{2.30}
Pij = c (
) l/(rn-l) .
L dij/dfk
k=l
These class membership values of a pixel denote the class proportions and
are treated as sub-pixel classifications. The sub-pixel classifications are represented in the form of fraction or proportion images, equal to the number
of classes being mapped. In Chap. 11, a Markov random field {MRF} model
based approach for sub-pixel classification of multi and hyperspectral data is
presented.
75
determine the class composition of a mixed pixel is linear mixture modeling
{LMM}, also referred to as spectral mixture analysis {Settle and Drake 1993}.
The objective of mixture modeling is to unmix the classes that are identifiable
at some finer spatial scale. It is based on the assumption that the spectral
response of an individual pixel is the linear sum of the spectral responses of
the component classes of the pixels weighted by their relative proportions. The
details on LMM algorithm can be found in Settle and Drake {1993}.
However, to adopt fuzzy classification outputs from either MLC or LMM, the
data need to satisfy statistical distribution assumptions, which as discussed
before are often untenable. Alternative methods such as fuzzy set and neural
network based classification, which are non-parametric in nature, may be more
appropriate. Besides providing crisp classification outputs, these approaches
may also be used to extract information at sub-pixel level. For instance, class
membership values from the most widely used fuzzy c-means {FCM} clustering
{described briefly here} and the activation levels of the output unit of a neural
network may be used to represent the class composition of a mixed pixel
{Foody and Arora 1996}.
FCM clustering is an iterative clustering algorithm where class membership
values are obtained by minimizing the generalized least -square error function
given by {Bezdek et al. 1984}
{2.29}
where pi is the vector of cluster centers {i. e. class means}, Pij are class membership values of a pixel, c and n are number of classes and pixels respectively,
IIXi - pj II~ is the squared distance {dij} between spectral response of a pixel
Xj and the class mean pi and m is a weighting exponent, which controls the
degree of fuzziness. The value of m varies from 1 {no fuzziness} to 00 {complete
fuzziness}. Earlier studies have shown that there is no optimal value of m but
a value in the range 1.5 to 3 can generally be adopted. The class membership
Pij is computed from
1
{2.30}
Pij = c (
) l/(rn-l) .
L dij/dfk
k=l
These class membership values of a pixel denote the class proportions and
are treated as sub-pixel classifications. The sub-pixel classifications are represented in the form of fraction or proportion images, equal to the number
of classes being mapped. In Chap. 11, a Markov random field {MRF} model
based approach for sub-pixel classification of multi and hyperspectral data is
presented.