

Image Change Detection and Fusion Using MRF Models
303
The street
a
b
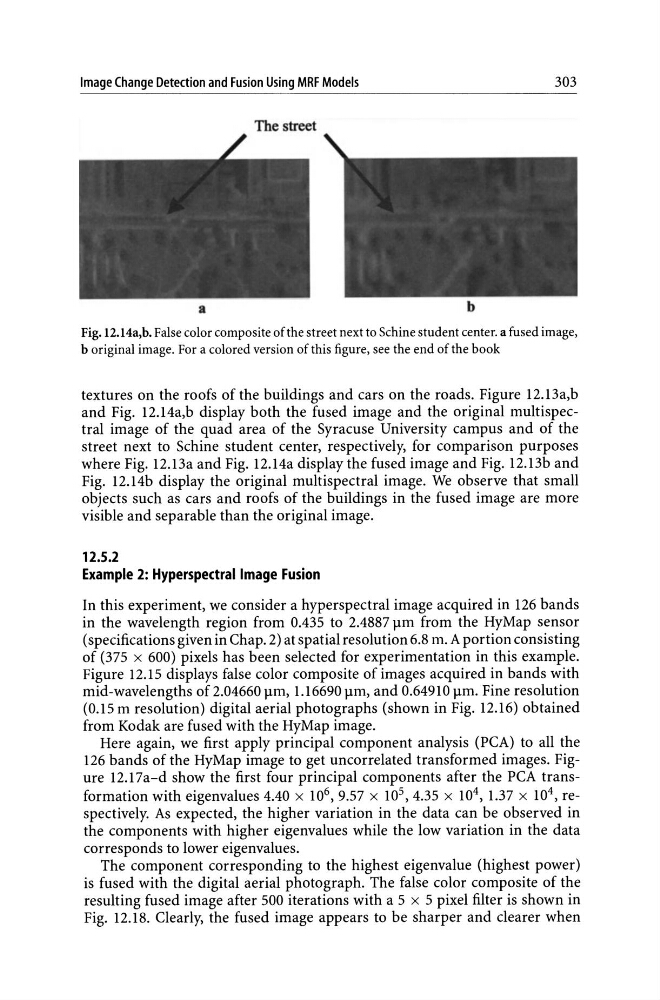
Fig.12.14a,b. False color composite of the street next to Schine student center. a fused image,
b original image. For a colored version of this figure, see the end of the book
textures on the roofs of the buildings and cars on the roads. Figure 12.13a,b
and Fig. 12.14a,b display both the fused image and the original multispectral image of the quad area of the Syracuse University campus and of the
street next to Schine student center, respectively, for comparison purposes
where Fig. 12.13a and Fig. 12.14a display the fused image and Fig. 12.13b and
Fig. 12.14b display the original multispectral image. We observe that small
objects such as cars and roofs of the buildings in the fused image are more
visible and separable than the original image.
12.5.2
Example 2: Hyperspectrallmage Fusion
In this experiment, we consider a hyperspectral image acquired in 126 bands
in the wavelength region from 0.435 to 2.4887}lm from the HyMap sensor
(specifications given in Chap. 2) at spatial resolution 6.8 m. A portion consisting
of (375 x 600) pixels has been selected for experimentation in this example.
Figure 12.15 displays false color composite of images acquired in bands with
mid-wavelengths of 2.04660 }lm, 1.16690 }lm, and 0.64910 }lm. Fine resolution
(0.15 m resolution) digital aerial photographs (shown in Fig. 12.16) obtained
from Kodak are fused with the HyMap image.
Here again, we first apply principal component analysis (PCA) to all the
126 bands of the HyMap image to get uncorrelated transformed images. Figure 12.17a-d show the first four principal components after the PCA transformation with eigenvalues 4.40 x 10 6 ,9.57 X 10 5 ,4.35 X 10 4 ,1.37 x 104, respectively. As expected, the higher variation in the data can be observed in
the components with higher eigenvalues while the low variation in the data
corresponds to lower eigenvalues.
The component corresponding to the highest eigenvalue (highest power)
is fused with the digital aerial photograph. The false color composite of the
resulting fused image after 500 iterations with a 5 x 5 pixel filter is shown in
Fig. 12.18. Clearly, the fused image appears to be sharper and clearer when
303
The street
a
b
Fig.12.14a,b. False color composite of the street next to Schine student center. a fused image,
b original image. For a colored version of this figure, see the end of the book
textures on the roofs of the buildings and cars on the roads. Figure 12.13a,b
and Fig. 12.14a,b display both the fused image and the original multispectral image of the quad area of the Syracuse University campus and of the
street next to Schine student center, respectively, for comparison purposes
where Fig. 12.13a and Fig. 12.14a display the fused image and Fig. 12.13b and
Fig. 12.14b display the original multispectral image. We observe that small
objects such as cars and roofs of the buildings in the fused image are more
visible and separable than the original image.
12.5.2
Example 2: Hyperspectrallmage Fusion
In this experiment, we consider a hyperspectral image acquired in 126 bands
in the wavelength region from 0.435 to 2.4887}lm from the HyMap sensor
(specifications given in Chap. 2) at spatial resolution 6.8 m. A portion consisting
of (375 x 600) pixels has been selected for experimentation in this example.
Figure 12.15 displays false color composite of images acquired in bands with
mid-wavelengths of 2.04660 }lm, 1.16690 }lm, and 0.64910 }lm. Fine resolution
(0.15 m resolution) digital aerial photographs (shown in Fig. 12.16) obtained
from Kodak are fused with the HyMap image.
Here again, we first apply principal component analysis (PCA) to all the
126 bands of the HyMap image to get uncorrelated transformed images. Figure 12.17a-d show the first four principal components after the PCA transformation with eigenvalues 4.40 x 10 6 ,9.57 X 10 5 ,4.35 X 10 4 ,1.37 x 104, respectively. As expected, the higher variation in the data can be observed in
the components with higher eigenvalues while the low variation in the data
corresponds to lower eigenvalues.
The component corresponding to the highest eigenvalue (highest power)
is fused with the digital aerial photograph. The false color composite of the
resulting fused image after 500 iterations with a 5 x 5 pixel filter is shown in
Fig. 12.18. Clearly, the fused image appears to be sharper and clearer when