

288
12: Teerasit Kasetkasem, Pramod K. Varshney
20
40
60
80
20
40
60
80
100 120
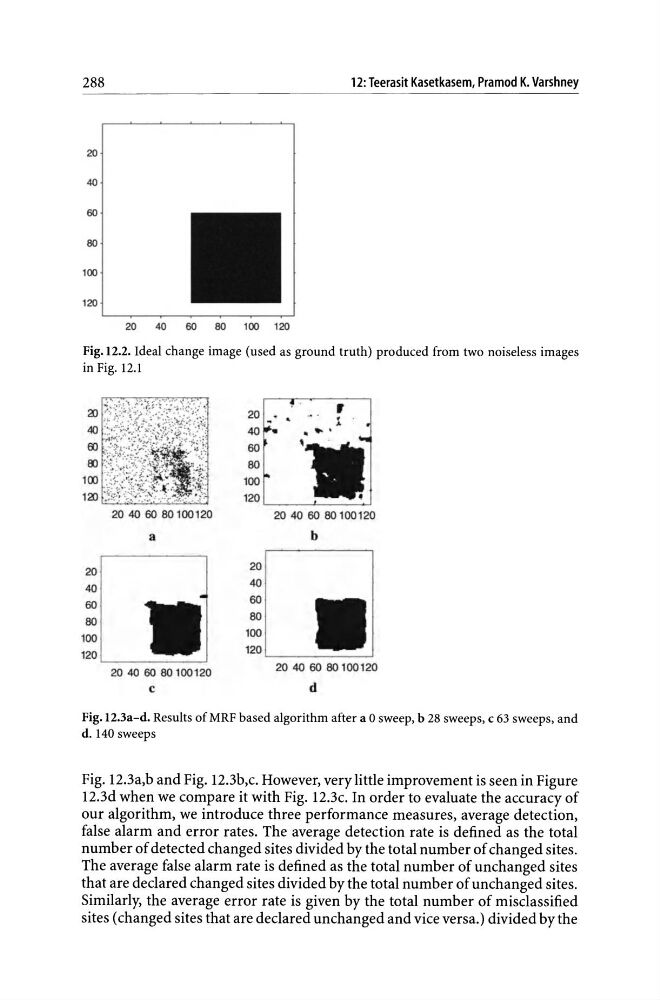
Fig. 12.2. Ideal change image (used as ground truth) produced from two noiseless images
in Fig. 12.1
20
40
60
80
100
204060 80 100120
a
120 L -_ _ _ _ _ --'
20 40 60 80100120
C
20.
r
•
..
. . . .
,
100
120
20 40 60 80 100120
b
20
40
60
80
100
120
20 40 60 80 100120
d
Fig.12.3a-d. Results of MRF based algorithm after a 0 sweep, b 28 sweeps, c 63 sweeps, and
d. 140 sweeps
Fig. 12.3a,b and Fig. 12.3b,c. However, very little improvement is seen in Figure
12.3d when we compare it with Fig. 12.3c. In order to evaluate the accuracy of
our algorithm, we introduce three performance measures, average detection,
false alarm and error rates. The average detection rate is defined as the total
number of detected changed sites divided by the total number of changed sites.
The average false alarm rate is defined as the total number of unchanged sites
that are declared changed sites divided by the total number of unchanged sites.
Similarly, the average error rate is given by the total number of misclassified
sites (changed sites that are declared unchanged and vice versa.) divided by the
12: Teerasit Kasetkasem, Pramod K. Varshney
20
40
60
80
20
40
60
80
100 120
Fig. 12.2. Ideal change image (used as ground truth) produced from two noiseless images
in Fig. 12.1
20
40
60
80
100
204060 80 100120
a
120 L -_ _ _ _ _ --'
20 40 60 80100120
C
20.
r
•
..
. . . .
,
100
120
20 40 60 80 100120
b
20
40
60
80
100
120
20 40 60 80 100120
d
Fig.12.3a-d. Results of MRF based algorithm after a 0 sweep, b 28 sweeps, c 63 sweeps, and
d. 140 sweeps
Fig. 12.3a,b and Fig. 12.3b,c. However, very little improvement is seen in Figure
12.3d when we compare it with Fig. 12.3c. In order to evaluate the accuracy of
our algorithm, we introduce three performance measures, average detection,
false alarm and error rates. The average detection rate is defined as the total
number of detected changed sites divided by the total number of changed sites.
The average false alarm rate is defined as the total number of unchanged sites
that are declared changed sites divided by the total number of unchanged sites.
Similarly, the average error rate is given by the total number of misclassified
sites (changed sites that are declared unchanged and vice versa.) divided by the