

An MRF Model Based Approachfor Sub-pixel Mapping from Hyperspectral Data
271
11.4.2
Experiment 2: Sub-pixel Mapping from Hyperspectral Data
In this experiment, we consider a hyperspectral image acquired in 126 bands
in the wavelength region from 0.435 to 2.488 pm from the HyMap sensor (for
specifications see Chap. 2) at spatial resolution 6.8 m. A portion consisting of
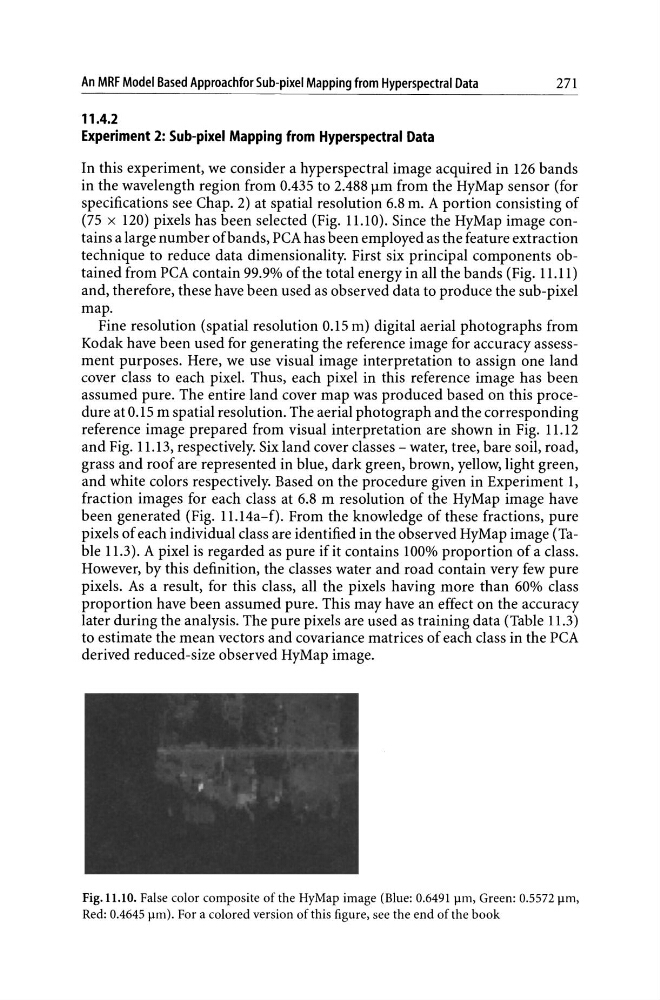
(75 x 120) pixels has been selected (Fig. 11.10). Since the HyMap image contains a large number of bands, PCA has been employed as the feature extraction
technique to reduce data dimensionality. First six principal components obtained from PCA contain 99.9% of the total energy in all the bands (Fig. 11.11)
and, therefore, these have been used as observed data to produce the sub-pixel
map.
Fine resolution (spatial resolution 0.15 m) digital aerial photographs from
Kodak have been used for generating the reference image for accuracy assessment purposes. Here, we use visual image interpretation to assign one land
cover class to each pixel. Thus, each pixel in this reference image has been
assumed pure. The entire land cover map was produced based on this procedure at 0.15 m spatial resolution. The aerial photograph and the corresponding
reference image prepared from visual interpretation are shown in Fig. 11.12
and Fig. 11 .13, respectively. Six land cover classes - water, tree, bare soil, road,
grass and roof are represented in blue, dark green, brown, yellow, light green,
and white colors respectively. Based on the procedure given in Experiment 1,
fraction images for each class at 6.8 m resolution of the HyMap image have
been generated (Fig. 11.14a-f). From the knowledge of these fractions, pure
pixels of each individual class are identified in the observed HyMap image (Table 11.3). A pixel is regarded as pure if it contains 100% proportion of a class.
However, by this definition, the classes water and road contain very few pure
pixels. As a result, for this class, all the pixels having more than 60% class
proportion have been assumed pure. This may have an effect on the accuracy
later during the analysis. The pure pixels are used as training data (Table 11.3)
to estimate the mean vectors and covariance matrices of each class in the PCA
derived reduced-size observed HyMap image.
Fig. Il.IO. False color composite of the HyMap image (Blue: 0.6491 ~m, Green: 0.5572 ~m,
Red: 0.4645 ~m). For a colored version of this figure, see the end of the book
271
11.4.2
Experiment 2: Sub-pixel Mapping from Hyperspectral Data
In this experiment, we consider a hyperspectral image acquired in 126 bands
in the wavelength region from 0.435 to 2.488 pm from the HyMap sensor (for
specifications see Chap. 2) at spatial resolution 6.8 m. A portion consisting of
(75 x 120) pixels has been selected (Fig. 11.10). Since the HyMap image contains a large number of bands, PCA has been employed as the feature extraction
technique to reduce data dimensionality. First six principal components obtained from PCA contain 99.9% of the total energy in all the bands (Fig. 11.11)
and, therefore, these have been used as observed data to produce the sub-pixel
map.
Fine resolution (spatial resolution 0.15 m) digital aerial photographs from
Kodak have been used for generating the reference image for accuracy assessment purposes. Here, we use visual image interpretation to assign one land
cover class to each pixel. Thus, each pixel in this reference image has been
assumed pure. The entire land cover map was produced based on this procedure at 0.15 m spatial resolution. The aerial photograph and the corresponding
reference image prepared from visual interpretation are shown in Fig. 11.12
and Fig. 11 .13, respectively. Six land cover classes - water, tree, bare soil, road,
grass and roof are represented in blue, dark green, brown, yellow, light green,
and white colors respectively. Based on the procedure given in Experiment 1,
fraction images for each class at 6.8 m resolution of the HyMap image have
been generated (Fig. 11.14a-f). From the knowledge of these fractions, pure
pixels of each individual class are identified in the observed HyMap image (Table 11.3). A pixel is regarded as pure if it contains 100% proportion of a class.
However, by this definition, the classes water and road contain very few pure
pixels. As a result, for this class, all the pixels having more than 60% class
proportion have been assumed pure. This may have an effect on the accuracy
later during the analysis. The pure pixels are used as training data (Table 11.3)
to estimate the mean vectors and covariance matrices of each class in the PCA
derived reduced-size observed HyMap image.
Fig. Il.IO. False color composite of the HyMap image (Blue: 0.6491 ~m, Green: 0.5572 ~m,
Red: 0.4645 ~m). For a colored version of this figure, see the end of the book