

An MRF Model Based Approachfor Sub-pixel Mapping from Hyperspectral Data
269
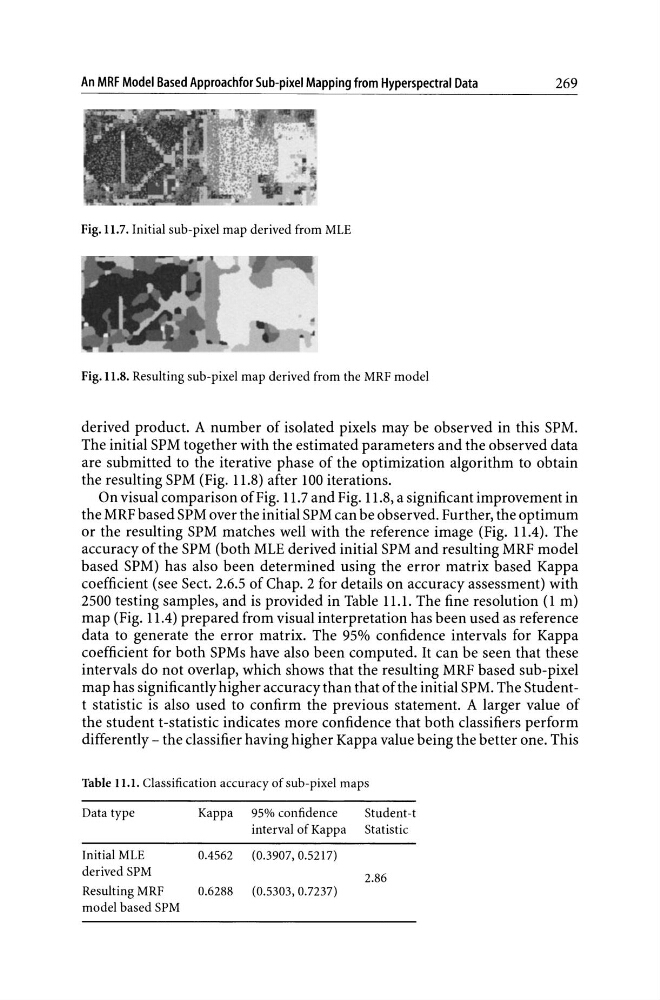
Fig.Il.7. Initial sub-pixel map derived from MLE
Fig. 11.8. Resulting sub-pixel map derived from the MRF model
derived product. A number of isolated pixels may be observed in this SPM.
The initial SPM together with the estimated parameters and the observed data
are submitted to the iterative phase of the optimization algorithm to obtain
the resulting SPM (Fig. 11.8) after 100 iterations.
On visual comparison of Fig. 11.7 and Fig. 11.8, a significant improvement in
the MRF based SPM over the initial SPM can be observed. Further, the optimum
or the resulting SPM matches well with the reference image (Fig. 11.4). The
accuracy of the SPM (both MLE derived initial SPM and resulting MRF model
based SPM) has also been determined using the error matrix based Kappa
coefficient (see Sect. 2.6.5 of Chap. 2 for details on accuracy assessment) with
2500 testing samples, and is provided in Table 11.1. The fine resolution (1 m)
map (Fig. 1104) prepared from visual interpretation has been used as reference
data to generate the error matrix. The 95% confidence intervals for Kappa
coefficient for both SPMs have also been computed. It can be seen that these
intervals do not overlap, which shows that the resulting MRF based sub-pixel
map has significantly higher accuracy than that of the initial SPM. The Studentt statistic is also used to confirm the previous statement. A larger value of
the student t-statistic indicates more confidence that both classifiers perform
differently - the classifier having higher Kappa value being the better one. This
Table Il.l. Classification accuracy of sub-pixel maps
Data type
Kappa 95% confidence
Student-t
interval of Kappa Statistic
Initial MLE
0.4562
(0.3907, 0.5217)
derived SPM
2.86
Resulting MRF
0.6288
(0.5303,0.7237)
model based SPM
269
Fig.Il.7. Initial sub-pixel map derived from MLE
Fig. 11.8. Resulting sub-pixel map derived from the MRF model
derived product. A number of isolated pixels may be observed in this SPM.
The initial SPM together with the estimated parameters and the observed data
are submitted to the iterative phase of the optimization algorithm to obtain
the resulting SPM (Fig. 11.8) after 100 iterations.
On visual comparison of Fig. 11.7 and Fig. 11.8, a significant improvement in
the MRF based SPM over the initial SPM can be observed. Further, the optimum
or the resulting SPM matches well with the reference image (Fig. 11.4). The
accuracy of the SPM (both MLE derived initial SPM and resulting MRF model
based SPM) has also been determined using the error matrix based Kappa
coefficient (see Sect. 2.6.5 of Chap. 2 for details on accuracy assessment) with
2500 testing samples, and is provided in Table 11.1. The fine resolution (1 m)
map (Fig. 1104) prepared from visual interpretation has been used as reference
data to generate the error matrix. The 95% confidence intervals for Kappa
coefficient for both SPMs have also been computed. It can be seen that these
intervals do not overlap, which shows that the resulting MRF based sub-pixel
map has significantly higher accuracy than that of the initial SPM. The Studentt statistic is also used to confirm the previous statement. A larger value of
the student t-statistic indicates more confidence that both classifiers perform
differently - the classifier having higher Kappa value being the better one. This
Table Il.l. Classification accuracy of sub-pixel maps
Data type
Kappa 95% confidence
Student-t
interval of Kappa Statistic
Initial MLE
0.4562
(0.3907, 0.5217)
derived SPM
2.86
Resulting MRF
0.6288
(0.5303,0.7237)
model based SPM