

Hyperspectral Classification Using ICA Based Mixture Model
231
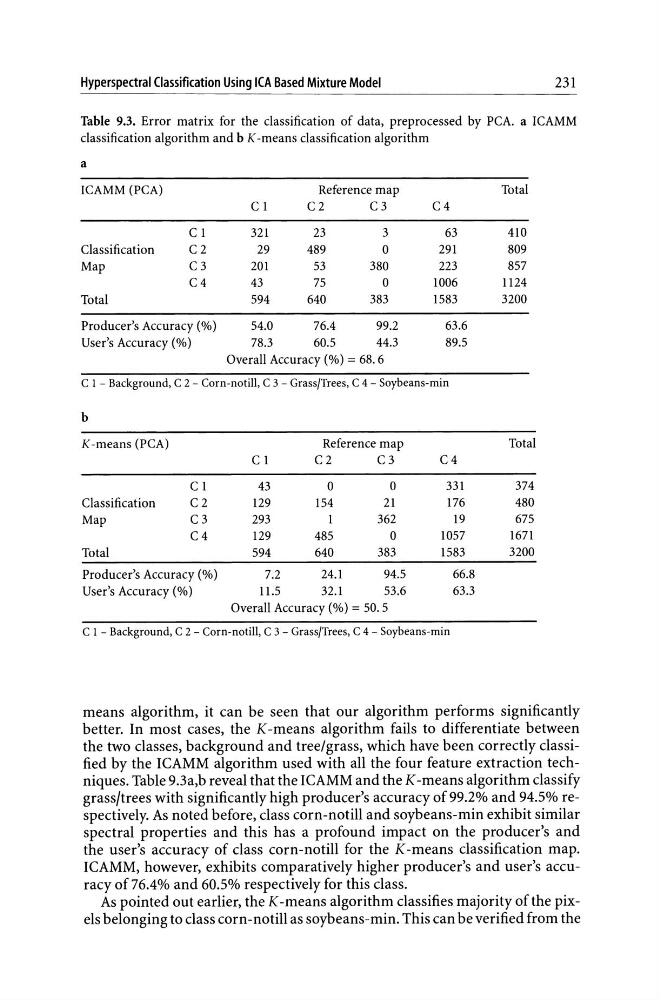
Table 9.3. Error matrix for the classification of data, preprocessed by PCA. a ICAMM
classification algorithm and b K-means classification algorithm
a
ICAMM(PCA)
Reference map
Total
C 1
C2
C3
C4
C 1
321
23
3
63
410
Classification
C2
29
489
0
291
809
Map
C3
201
53
380
223
857
C4
43
75
0
1006
1124
Total
594
640
383
1583
3200
Producer's Accuracy (%)
54.0
76.4
99.2
63.6
User's Accuracy (%)
78.3
60.5
44.3
89.5
Overall Accuracy (%) = 68.6
C 1 - Background, C 2 - Corn-notill, C 3 - Grass/Trees, C 4 - Soybeans-min
b
K-means (PCA)
Reference map
Total
C 1
C2
C3
C4
C1
43
0
0
331
374
Classification
C2
129
154
21
176
480
Map
C3
293
1
362
19
675
C4
129
485
0
1057
1671
Total
594
640
383
1583
3200
Producer's Accuracy (%)
7.2
24.1
94.5
66.8
User's Accuracy (%)
11.5
32.1
53.6
63.3
Overall Accuracy (%) = 50.5
C 1 - Background, C 2 - Corn-notill, C 3 - Grass/Trees, C 4 - Soybeans-min
means algorithm, it can be seen that our algorithm performs significantly
better. In most cases, the K-means algorithm fails to differentiate between
the two classes, background and tree/grass, which have been correctly classified by the ICAMM algorithm used with all the four feature extraction techniques. Table 9.3a,b reveal that the ICAMM and the K -means algorithm classify
grass/trees with significantly high producer's accuracy of 99.2% and 94.5% respectively. As noted before, class corn-not ill and soybeans-min exhibit similar
spectral properties and this has a profound impact on the producer's and
the user's accuracy of class corn-notill for the K-means classification map.
ICAMM, however, exhibits comparatively higher producer's and user's accuracy of 76.4% and 60.5% respectively for this class.
As pointed out earlier, the K -means algorithm classifies majority of the pixels belonging to class corn -not ill as soybeans-min. This can be verified from the
231
Table 9.3. Error matrix for the classification of data, preprocessed by PCA. a ICAMM
classification algorithm and b K-means classification algorithm
a
ICAMM(PCA)
Reference map
Total
C 1
C2
C3
C4
C 1
321
23
3
63
410
Classification
C2
29
489
0
291
809
Map
C3
201
53
380
223
857
C4
43
75
0
1006
1124
Total
594
640
383
1583
3200
Producer's Accuracy (%)
54.0
76.4
99.2
63.6
User's Accuracy (%)
78.3
60.5
44.3
89.5
Overall Accuracy (%) = 68.6
C 1 - Background, C 2 - Corn-notill, C 3 - Grass/Trees, C 4 - Soybeans-min
b
K-means (PCA)
Reference map
Total
C 1
C2
C3
C4
C1
43
0
0
331
374
Classification
C2
129
154
21
176
480
Map
C3
293
1
362
19
675
C4
129
485
0
1057
1671
Total
594
640
383
1583
3200
Producer's Accuracy (%)
7.2
24.1
94.5
66.8
User's Accuracy (%)
11.5
32.1
53.6
63.3
Overall Accuracy (%) = 50.5
C 1 - Background, C 2 - Corn-notill, C 3 - Grass/Trees, C 4 - Soybeans-min
means algorithm, it can be seen that our algorithm performs significantly
better. In most cases, the K-means algorithm fails to differentiate between
the two classes, background and tree/grass, which have been correctly classified by the ICAMM algorithm used with all the four feature extraction techniques. Table 9.3a,b reveal that the ICAMM and the K -means algorithm classify
grass/trees with significantly high producer's accuracy of 99.2% and 94.5% respectively. As noted before, class corn-not ill and soybeans-min exhibit similar
spectral properties and this has a profound impact on the producer's and
the user's accuracy of class corn-notill for the K-means classification map.
ICAMM, however, exhibits comparatively higher producer's and user's accuracy of 76.4% and 60.5% respectively for this class.
As pointed out earlier, the K -means algorithm classifies majority of the pixels belonging to class corn -not ill as soybeans-min. This can be verified from the