

Hyperspectral Classification Using ICA Based Mixture Model
229
information pertaining to this class is split into several features. The first three
features from PP (Fig. 9.3d) reveal that though the information pertaining to
classes background and grassltrees has been significantly enhanced, it does not
capture enough information needed to distinguish the remaining two classes
(i.e. corn-notill and soybeans-min). However, it is interesting to note that the
fourth feature generated by PP exhibits a significant amount of information
when compared with the fourth feature generated by each of PCA, SPCA and
OSP. A remark applicable to each of these feature extraction techniques is that
they show excellent performance in extracting the information corresponding to classes background and grass/trees, but provide not much variability
between the remaining two classes. This observation confirms the earlier discussion, where we had noted that corn-notill and soybeans-min have almost
equal mean spectral responses in many of the bands, leading to a non-linear
separability between these two classes.
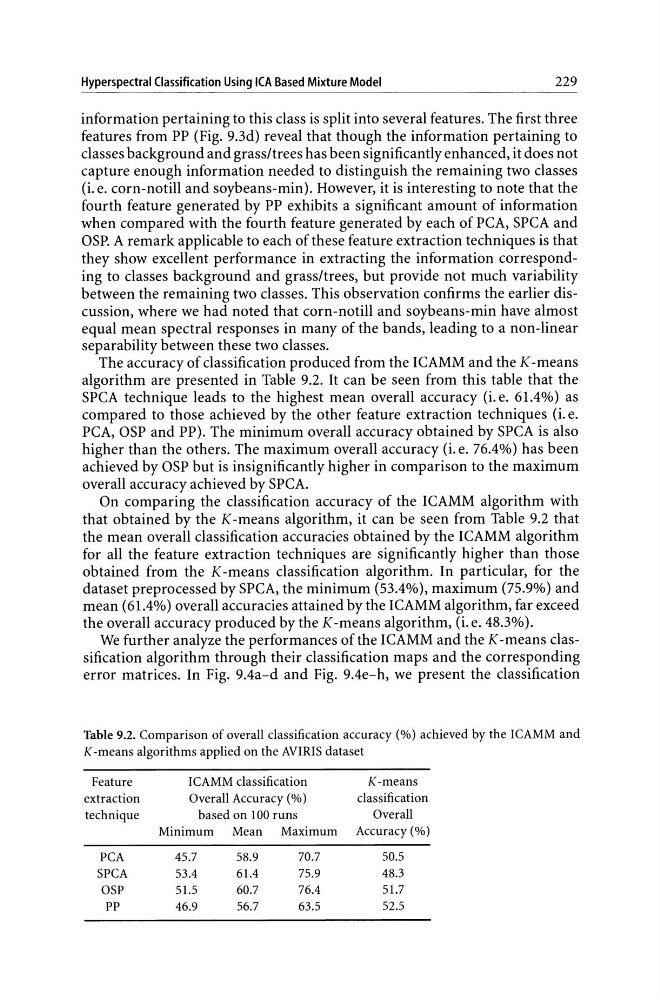
The accuracy of classification produced from the I CAMM and the K -means
algorithm are presented in Table 9.2. It can be seen from this table that the
SPCA technique leads to the highest mean overall accuracy (i.e. 61.4%) as
compared to those achieved by the other feature extraction techniques (i. e.
PCA, OSP and PP). The minimum overall accuracy obtained by SPCA is also
higher than the others. The maximum overall accuracy (i. e. 76.4%) has been
achieved by OSP but is insignificantly higher in comparison to the maximum
overall accuracy achieved by SPCA.
On comparing the classification accuracy of the ICAMM algorithm with
that obtained by the K-means algorithm, it can be seen from Table 9.2 that
the mean overall classification accuracies obtained by the ICAMM algorithm
for all the feature extraction techniques are significantly higher than those
obtained from the K-means classification algorithm. In particular, for the
dataset preprocessed by SPCA, the minimum (53.4%), maximum (75.9%) and
mean (61.4%) overall accuracies attained by the ICAMM algorithm, far exceed
the overall accuracy produced by the K-means algorithm, (i. e. 48.3%).
We further analyze the performances of the ICAMM and the K-means classification algorithm through their classification maps and the corresponding
error matrices. In Fig. 9.4a-d and Fig. 9.4e-h, we present the classification
Table 9.2. Comparison of overall classification accuracy (%) achieved by the ICAMM and
K-means algorithms applied on the AVIRIS dataset
Feature
ICAMM classification
K-means
extraction
Overall Accuracy (%)
classification
technique
based on 100 runs
Overall
Minimum Mean Maximum Accuracy (%)
PCA
45.7
58.9
70.7
50.5
SPCA
53.4
61.4
75.9
48.3
OSP
51.5
60.7
76.4
51.7
PP
46.9
56.7
63.5
52.5
229
information pertaining to this class is split into several features. The first three
features from PP (Fig. 9.3d) reveal that though the information pertaining to
classes background and grassltrees has been significantly enhanced, it does not
capture enough information needed to distinguish the remaining two classes
(i.e. corn-notill and soybeans-min). However, it is interesting to note that the
fourth feature generated by PP exhibits a significant amount of information
when compared with the fourth feature generated by each of PCA, SPCA and
OSP. A remark applicable to each of these feature extraction techniques is that
they show excellent performance in extracting the information corresponding to classes background and grass/trees, but provide not much variability
between the remaining two classes. This observation confirms the earlier discussion, where we had noted that corn-notill and soybeans-min have almost
equal mean spectral responses in many of the bands, leading to a non-linear
separability between these two classes.
The accuracy of classification produced from the I CAMM and the K -means
algorithm are presented in Table 9.2. It can be seen from this table that the
SPCA technique leads to the highest mean overall accuracy (i.e. 61.4%) as
compared to those achieved by the other feature extraction techniques (i. e.
PCA, OSP and PP). The minimum overall accuracy obtained by SPCA is also
higher than the others. The maximum overall accuracy (i. e. 76.4%) has been
achieved by OSP but is insignificantly higher in comparison to the maximum
overall accuracy achieved by SPCA.
On comparing the classification accuracy of the ICAMM algorithm with
that obtained by the K-means algorithm, it can be seen from Table 9.2 that
the mean overall classification accuracies obtained by the ICAMM algorithm
for all the feature extraction techniques are significantly higher than those
obtained from the K-means classification algorithm. In particular, for the
dataset preprocessed by SPCA, the minimum (53.4%), maximum (75.9%) and
mean (61.4%) overall accuracies attained by the ICAMM algorithm, far exceed
the overall accuracy produced by the K-means algorithm, (i. e. 48.3%).
We further analyze the performances of the ICAMM and the K-means classification algorithm through their classification maps and the corresponding
error matrices. In Fig. 9.4a-d and Fig. 9.4e-h, we present the classification
Table 9.2. Comparison of overall classification accuracy (%) achieved by the ICAMM and
K-means algorithms applied on the AVIRIS dataset
Feature
ICAMM classification
K-means
extraction
Overall Accuracy (%)
classification
technique
based on 100 runs
Overall
Minimum Mean Maximum Accuracy (%)
PCA
45.7
58.9
70.7
50.5
SPCA
53.4
61.4
75.9
48.3
OSP
51.5
60.7
76.4
51.7
PP
46.9
56.7
63.5
52.5