

96
3: Hua-mei Chen
0.9
0.9
0.8
0.8
0.7
0.7
0.6
0.6
0.5
0.5
0.4
0.4
0.3 '---~~-~~-~~~-~---'
0.3 L-~~_~~_~~_~~--'
a 5 10 15 20 25 30 35 40 45
a 5 10 15 20 25 30 35 40 45
a
b
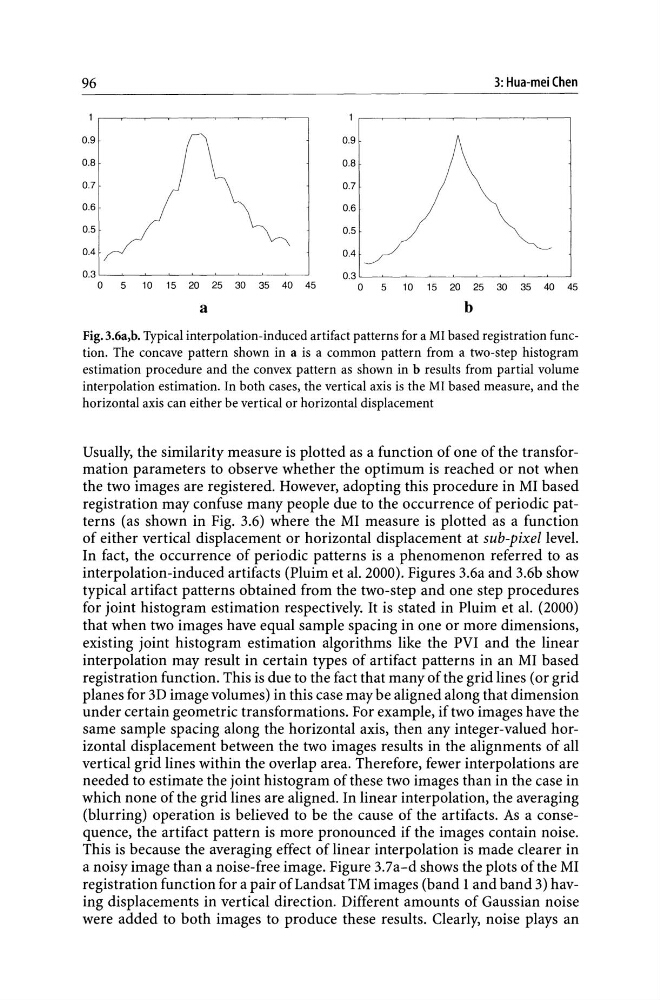
Fig. 3.6a,b. Typical interpolation-induced artifact patterns for a MI based registration function. The concave pattern shown in a is a common pattern from a two-step histogram
estimation procedure and the convex pattern as shown in b results from partial volume
interpolation estimation. In both cases, the vertical axis is the MI based measure, and the
horizontal axis can either be vertical or horizontal displacement
Usually, the similarity measure is plotted as a function of one of the transformation parameters to observe whether the optimum is reached or not when
the two images are registered. However, adopting this procedure in MI based
registration may confuse many people due to the occurrence of periodic patterns (as shown in Fig. 3.6) where the MI measure is plotted as a function
of either vertical displacement or horizontal displacement at sub-pixel level.
In fact, the occurrence of periodic patterns is a phenomenon referred to as
interpolation-induced artifacts (Pluim et al. 2000). Figures 3.6a and 3.6b show
typical artifact patterns obtained from the two-step and one step procedures
for joint histogram estimation respectively. It is stated in Pluim et al. (2000)
that when two images have equal sample spacing in one or more dimensions,
existing joint histogram estimation algorithms like the PVI and the linear
interpolation may result in certain types of artifact patterns in an MI based
registration function. This is due to the fact that many of the grid lines (or grid
planes for 3D image volumes) in this case may be aligned along that dimension
under certain geometric transformations. For example, if two images have the
same sample spacing along the horizontal axis, then any integer-valued horizontal displacement between the two images results in the alignments of all
vertical grid lines within the overlap area. Therefore, fewer interpolations are
needed to estimate the joint histogram of these two images than in the case in
which none of the grid lines are aligned. In linear interpolation, the averaging
(blurring) operation is believed to be the cause of the artifacts. As a consequence, the artifact pattern is more pronounced if the images contain noise.
This is because the averaging effect of linear interpolation is made clearer in
a noisy image than a noise-free image. Figure 3.7a-d shows the plots of the MI
registration function for a pair of Landsat TM images (band 1 and band 3) having displacements in vertical direction. Different amounts of Gaussian noise
were added to both images to produce these results. Clearly, noise plays an
3: Hua-mei Chen
0.9
0.9
0.8
0.8
0.7
0.7
0.6
0.6
0.5
0.5
0.4
0.4
0.3 '---~~-~~-~~~-~---'
0.3 L-~~_~~_~~_~~--'
a 5 10 15 20 25 30 35 40 45
a 5 10 15 20 25 30 35 40 45
a
b
Fig. 3.6a,b. Typical interpolation-induced artifact patterns for a MI based registration function. The concave pattern shown in a is a common pattern from a two-step histogram
estimation procedure and the convex pattern as shown in b results from partial volume
interpolation estimation. In both cases, the vertical axis is the MI based measure, and the
horizontal axis can either be vertical or horizontal displacement
Usually, the similarity measure is plotted as a function of one of the transformation parameters to observe whether the optimum is reached or not when
the two images are registered. However, adopting this procedure in MI based
registration may confuse many people due to the occurrence of periodic patterns (as shown in Fig. 3.6) where the MI measure is plotted as a function
of either vertical displacement or horizontal displacement at sub-pixel level.
In fact, the occurrence of periodic patterns is a phenomenon referred to as
interpolation-induced artifacts (Pluim et al. 2000). Figures 3.6a and 3.6b show
typical artifact patterns obtained from the two-step and one step procedures
for joint histogram estimation respectively. It is stated in Pluim et al. (2000)
that when two images have equal sample spacing in one or more dimensions,
existing joint histogram estimation algorithms like the PVI and the linear
interpolation may result in certain types of artifact patterns in an MI based
registration function. This is due to the fact that many of the grid lines (or grid
planes for 3D image volumes) in this case may be aligned along that dimension
under certain geometric transformations. For example, if two images have the
same sample spacing along the horizontal axis, then any integer-valued horizontal displacement between the two images results in the alignments of all
vertical grid lines within the overlap area. Therefore, fewer interpolations are
needed to estimate the joint histogram of these two images than in the case in
which none of the grid lines are aligned. In linear interpolation, the averaging
(blurring) operation is believed to be the cause of the artifacts. As a consequence, the artifact pattern is more pronounced if the images contain noise.
This is because the averaging effect of linear interpolation is made clearer in
a noisy image than a noise-free image. Figure 3.7a-d shows the plots of the MI
registration function for a pair of Landsat TM images (band 1 and band 3) having displacements in vertical direction. Different amounts of Gaussian noise
were added to both images to produce these results. Clearly, noise plays an