

where Ȝ denotes wavelength. Three groups of water absorbing constituents are
considered: phytoplankton, non-chlorophyllous particles, and Gelbstoff.
Phytoplankton. The high number of species that occur in natural waters causes
variability in phytoplankton absorption properties. This is accounted for by the
inclusion of 6 specific absorption spectra, a i *(Ȝ). If no phytoplankton classification is
performed, the spectrum a 0 *(Ȝ) is selected to represent the specific absorption of
phytoplankton. C i indicates pigment concentration, where “pigment” is the sum of
chlorophyll a and phaeophytin a.
The default spectra provided with WASI are based on measurements at Lake
Constance. The five spectra a 1 *(Ȝ)…a 5 *(Ȝ) represent the lake’s major optical classes
“cryptophyta type L”, “cryptophyta type H”, “diatoms”, “dinoflagellates”, and “green
algae” (Gege, 1994, 1995, 1998b). The spectrum a 0 *(Ȝ) is a weighted sum of these five
spectra and represents a mixture which can be considered as typical for that lake. This
was calculated by Heege (2000) using in-situ spectra of phytoplankton absorption
which were derived from reflectance measurements (Gege, 1994, 1995) and pigment
data from 32 days in 1990 and 1991. The spectrum a 0 *(Ȝ) was validated (by Heege)
using 139 irradiance reflectance and 278 attenuation measurements from 1990 to 1996.
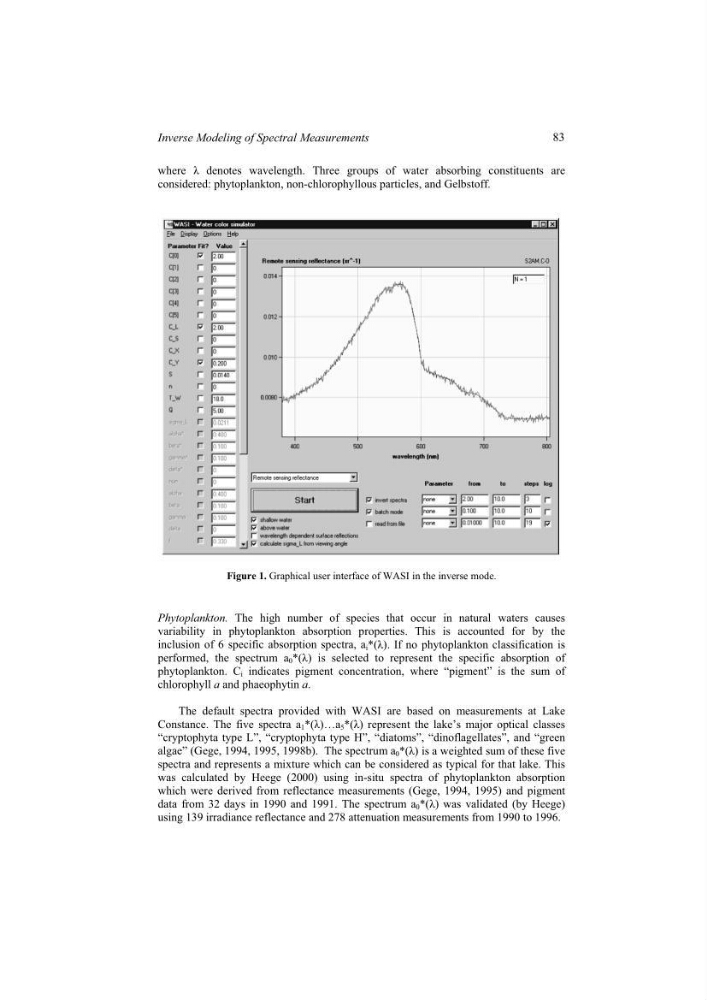
Figure 1. Graphical user interface of WASI in the inverse mode.
83
Inverse Modeling of Spectral Measurements
considered: phytoplankton, non-chlorophyllous particles, and Gelbstoff.
Phytoplankton. The high number of species that occur in natural waters causes
variability in phytoplankton absorption properties. This is accounted for by the
inclusion of 6 specific absorption spectra, a i *(Ȝ). If no phytoplankton classification is
performed, the spectrum a 0 *(Ȝ) is selected to represent the specific absorption of
phytoplankton. C i indicates pigment concentration, where “pigment” is the sum of
chlorophyll a and phaeophytin a.
The default spectra provided with WASI are based on measurements at Lake
Constance. The five spectra a 1 *(Ȝ)…a 5 *(Ȝ) represent the lake’s major optical classes
“cryptophyta type L”, “cryptophyta type H”, “diatoms”, “dinoflagellates”, and “green
algae” (Gege, 1994, 1995, 1998b). The spectrum a 0 *(Ȝ) is a weighted sum of these five
spectra and represents a mixture which can be considered as typical for that lake. This
was calculated by Heege (2000) using in-situ spectra of phytoplankton absorption
which were derived from reflectance measurements (Gege, 1994, 1995) and pigment
data from 32 days in 1990 and 1991. The spectrum a 0 *(Ȝ) was validated (by Heege)
using 139 irradiance reflectance and 278 attenuation measurements from 1990 to 1996.
Figure 1. Graphical user interface of WASI in the inverse mode.
83
Inverse Modeling of Spectral Measurements