

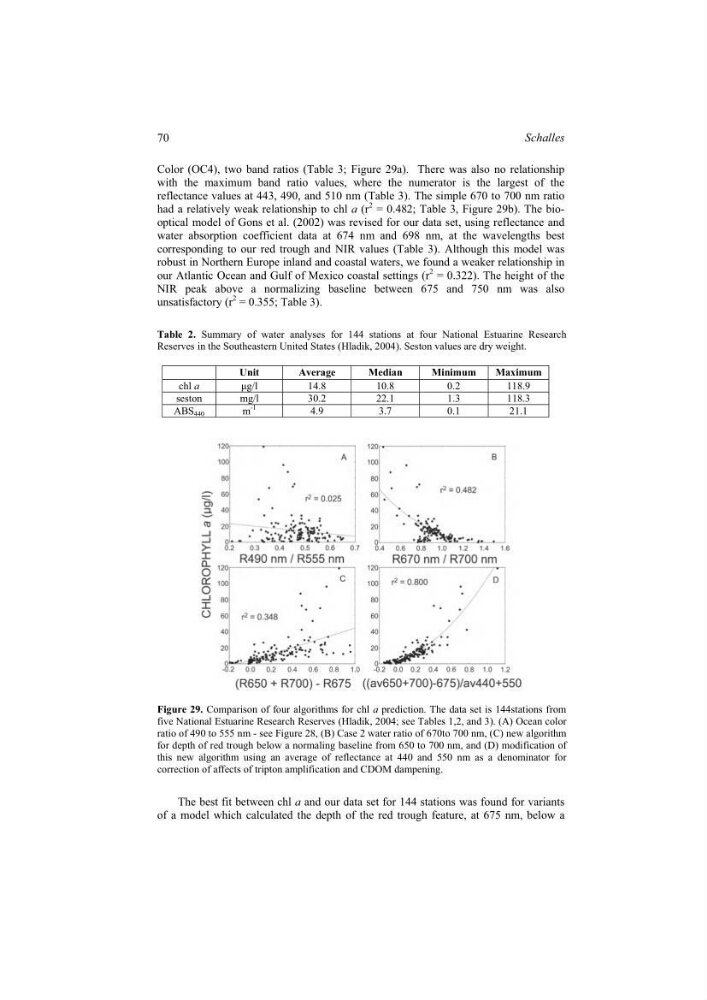
Color (OC4), two band ratios (Table 3; Figure 29a). There was also no relationship
with the maximum band ratio values, where the numerator is the largest of the
reflectance values at 443, 490, and 510 nm (Table 3). The simple 670 to 700 nm ratio
had a relatively weak relationship to chl a (r
2 = 0.482; Table 3, Figure 29b). The biooptical model of Gons et al. (2002) was revised for our data set, using reflectance and
water absorption coefficient data at 674 nm and 698 nm, at the wavelengths best
corresponding to our red trough and NIR values (Table 3). Although this model was
robust in Northern Europe inland and coastal waters, we found a weaker relationship in
our Atlantic Ocean and Gulf of Mexico coastal settings (r
2 = 0.322). The height of the
NIR peak above a normalizing baseline between 675 and 750 nm was also
unsatisfactory (r
2 = 0.355; Table 3).
Table 2. Summary of water analyses for 144 stations at four National Estuarine Research
Reserves in the Southeastern United States (Hladik, 2004). Seston values are dry weight.
Unit
Average
Median
Minimum
Maximum
chl a
µg/l
14.8
10.8
0.2
118.9
seston
mg/l
30.2
22.1
1.3
118.3
ABS 440
m
-1
4.9
3.7
0.1
21.1
Figure 29. Comparison of four algorithms for chl a prediction. The data set is 144stations from
five National Estuarine Research Reserves (Hladik, 2004; see Tables 1,2, and 3). (A) Ocean color
ratio of 490 to 555 nm - see Figure 28, (B) Case 2 water ratio of 670to 700 nm, (C) new algorithm
for depth of red trough below a normaling baseline from 650 to 700 nm, and (D) modification of
this new algorithm using an average of reflectance at 440 and 550 nm as a denominator for
correction of affects of tripton amplification and CDOM dampening.
The best fit between chl a and our data set for 144 stations was found for variants
of a model which calculated the depth of the red trough feature, at 675 nm, below a
70
Schalles
with the maximum band ratio values, where the numerator is the largest of the
reflectance values at 443, 490, and 510 nm (Table 3). The simple 670 to 700 nm ratio
had a relatively weak relationship to chl a (r
2 = 0.482; Table 3, Figure 29b). The biooptical model of Gons et al. (2002) was revised for our data set, using reflectance and
water absorption coefficient data at 674 nm and 698 nm, at the wavelengths best
corresponding to our red trough and NIR values (Table 3). Although this model was
robust in Northern Europe inland and coastal waters, we found a weaker relationship in
our Atlantic Ocean and Gulf of Mexico coastal settings (r
2 = 0.322). The height of the
NIR peak above a normalizing baseline between 675 and 750 nm was also
unsatisfactory (r
2 = 0.355; Table 3).
Table 2. Summary of water analyses for 144 stations at four National Estuarine Research
Reserves in the Southeastern United States (Hladik, 2004). Seston values are dry weight.
Unit
Average
Median
Minimum
Maximum
chl a
µg/l
14.8
10.8
0.2
118.9
seston
mg/l
30.2
22.1
1.3
118.3
ABS 440
m
-1
4.9
3.7
0.1
21.1
Figure 29. Comparison of four algorithms for chl a prediction. The data set is 144stations from
five National Estuarine Research Reserves (Hladik, 2004; see Tables 1,2, and 3). (A) Ocean color
ratio of 490 to 555 nm - see Figure 28, (B) Case 2 water ratio of 670to 700 nm, (C) new algorithm
for depth of red trough below a normaling baseline from 650 to 700 nm, and (D) modification of
this new algorithm using an average of reflectance at 440 and 550 nm as a denominator for
correction of affects of tripton amplification and CDOM dampening.
The best fit between chl a and our data set for 144 stations was found for variants
of a model which calculated the depth of the red trough feature, at 675 nm, below a
70
Schalles