

reference line between 650 nm and 700 nm, normalized as a ratio (average of
reflectance values at 650 and 700 nm minus reflectance at 675 nm - see Table 3). The
reference line position extends between the right edge of the shoulder near 650 nm and
the vicinity of the NIR peak. The r
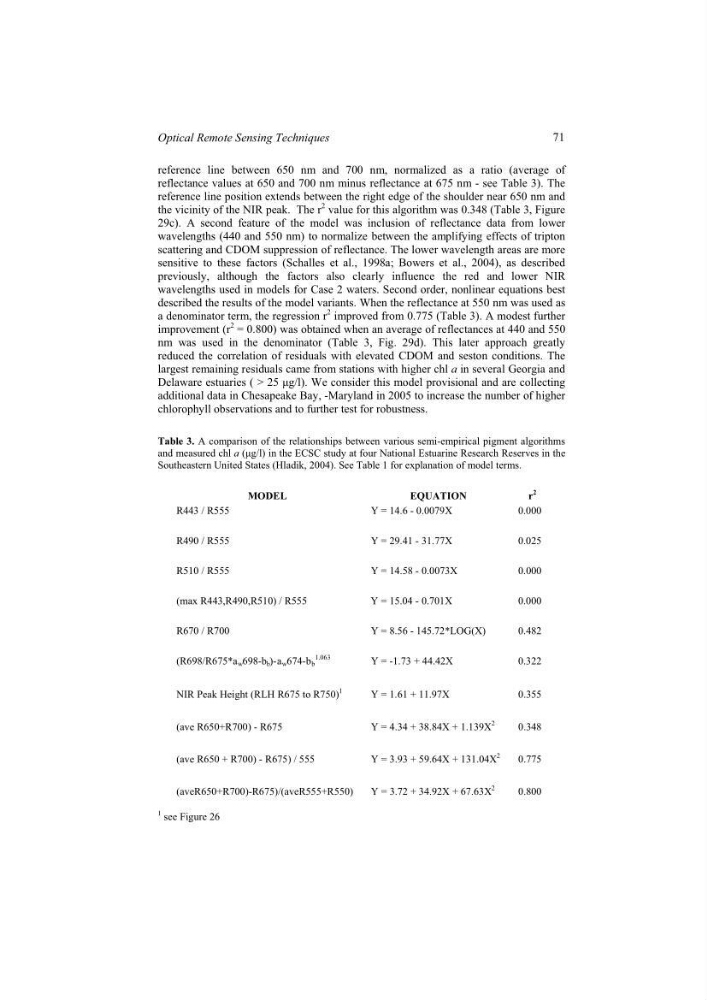
2 value for this algorithm was 0.348 (Table 3, Figure
29c). A second feature of the model was inclusion of reflectance data from lower
wavelengths (440 and 550 nm) to normalize between the amplifying effects of tripton
scattering and CDOM suppression of reflectance. The lower wavelength areas are more
sensitive to these factors (Schalles et al., 1998a; Bowers et al., 2004), as described
previously, although the factors also clearly influence the red and lower NIR
wavelengths used in models for Case 2 waters. Second order, nonlinear equations best
described the results of the model variants. When the reflectance at 550 nm was used as
a denominator term, the regression r
2 improved from 0.775 (Table 3). A modest further
improvement (r
2 = 0.800) was obtained when an average of reflectances at 440 and 550
nm was used in the denominator (Table 3, Fig. 29d). This later approach greatly
reduced the correlation of residuals with elevated CDOM and seston conditions. The
largest remaining residuals came from stations with higher chl a in several Georgia and
Delaware estuaries ( > 25 µg/l). We consider this model provisional and are collecting
additional data in Chesapeake Bay, -Maryland in 2005 to increase the number of higher
chlorophyll observations and to further test for robustness.
Table 3. A comparison of the relationships between various semi-empirical pigment algorithms
and measured chl a (µg/l) in the ECSC study at four National Estuarine Research Reserves in the
Southeastern United States (Hladik, 2004). See Table 1 for explanation of model terms.
MODEL
EQUATION
r
2
R443 / R555
Y = 14.6 - 0.0079X
0.000
R490 / R555
Y = 29.41 - 31.77X
0.025
R510 / R555
Y = 14.58 - 0.0073X
0.000
(max R443,R490,R510) / R555
Y = 15.04 - 0.701X
0.000
R670 / R700
Y = 8.56 - 145.72*LOG(X)
0.482
w
b
w
b
1.063
Y = -1.73 + 44.42X
0.322
NIR Peak Height (RLH R675 to R750)
1
Y = 1.61 + 11.97X
0.355
(ave R650+R700) - R675
Y = 4.34 + 38.84X + 1.139X
2
0.348
Y = 3.93 + 59.64X + 131.04X
2
0.775
Y = 3.72 + 34.92X + 67.63X
2
0.800
1 see Figure 26
71
Optical Remote Sensing Techniques
(R698/R675*a 698-b )-a 674-b
(ave R650 + R700) - R675) / 555
(aveR650+R700)-R675)/(aveR555+R550)
reflectance values at 650 and 700 nm minus reflectance at 675 nm - see Table 3). The
reference line position extends between the right edge of the shoulder near 650 nm and
the vicinity of the NIR peak. The r
2 value for this algorithm was 0.348 (Table 3, Figure
29c). A second feature of the model was inclusion of reflectance data from lower
wavelengths (440 and 550 nm) to normalize between the amplifying effects of tripton
scattering and CDOM suppression of reflectance. The lower wavelength areas are more
sensitive to these factors (Schalles et al., 1998a; Bowers et al., 2004), as described
previously, although the factors also clearly influence the red and lower NIR
wavelengths used in models for Case 2 waters. Second order, nonlinear equations best
described the results of the model variants. When the reflectance at 550 nm was used as
a denominator term, the regression r
2 improved from 0.775 (Table 3). A modest further
improvement (r
2 = 0.800) was obtained when an average of reflectances at 440 and 550
nm was used in the denominator (Table 3, Fig. 29d). This later approach greatly
reduced the correlation of residuals with elevated CDOM and seston conditions. The
largest remaining residuals came from stations with higher chl a in several Georgia and
Delaware estuaries ( > 25 µg/l). We consider this model provisional and are collecting
additional data in Chesapeake Bay, -Maryland in 2005 to increase the number of higher
chlorophyll observations and to further test for robustness.
Table 3. A comparison of the relationships between various semi-empirical pigment algorithms
and measured chl a (µg/l) in the ECSC study at four National Estuarine Research Reserves in the
Southeastern United States (Hladik, 2004). See Table 1 for explanation of model terms.
MODEL
EQUATION
r
2
R443 / R555
Y = 14.6 - 0.0079X
0.000
R490 / R555
Y = 29.41 - 31.77X
0.025
R510 / R555
Y = 14.58 - 0.0073X
0.000
(max R443,R490,R510) / R555
Y = 15.04 - 0.701X
0.000
R670 / R700
Y = 8.56 - 145.72*LOG(X)
0.482
w
b
w
b
1.063
Y = -1.73 + 44.42X
0.322
NIR Peak Height (RLH R675 to R750)
1
Y = 1.61 + 11.97X
0.355
(ave R650+R700) - R675
Y = 4.34 + 38.84X + 1.139X
2
0.348
Y = 3.93 + 59.64X + 131.04X
2
0.775
Y = 3.72 + 34.92X + 67.63X
2
0.800
1 see Figure 26
71
Optical Remote Sensing Techniques
(R698/R675*a 698-b )-a 674-b
(ave R650 + R700) - R675) / 555
(aveR650+R700)-R675)/(aveR555+R550)