

USB2000 spectroradiometers (Ocean Optics Corp., Dunedin, FL). Water samples were
filtered for pigment and seston analysis and filtrate was used for CDOM absorption
(Table 2). Algal pigments were extracted using 90% buffered acetone with a tissue
grinder. Spectral data were collected and processed with the CDAP software package
(CALMIT, University of Nebraska). We sampled 155 stations. Eleven stations, with
ratios of total depth to Secchi transparency less than 1.5, were eliminated from analysis
to avoid bottom reflectance biases. We measured a 600 fold range for chl a, a 200 fold
range for ABS 400 , and a 90 fold range for seston (Table 2). Correlations (r values)
between OACs were quite low: seston and chl a = 0.274, seston and ABS 440 = 0.031,
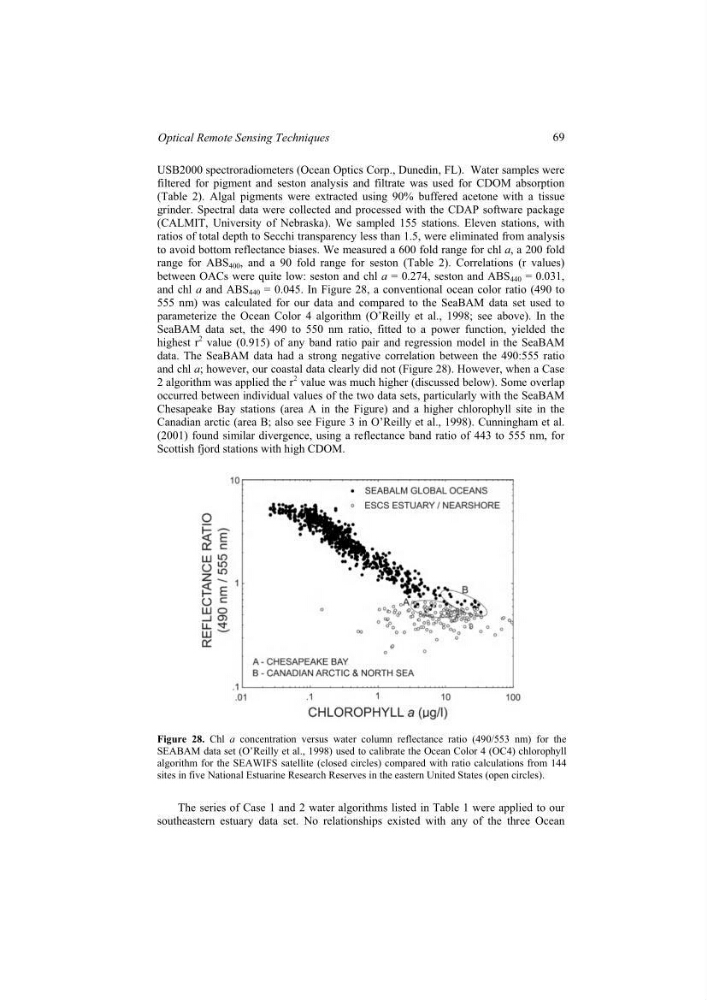
and chl a and ABS 440 = 0.045. In Figure 28, a conventional ocean color ratio (490 to
555 nm) was calculated for our data and compared to the SeaBAM data set used to
parameterize the Ocean Color 4 algorithm (O’Reilly et al., 1998; see above). In the
SeaBAM data set, the 490 to 550 nm ratio, fitted to a power function, yielded the
highest r
2 value (0.915) of any band ratio pair and regression model in the SeaBAM
data. The SeaBAM data had a strong negative correlation between the 490:555 ratio
and chl a; however, our coastal data clearly did not (Figure 28). However, when a Case
2 algorithm was applied the r
2 value was much higher (discussed below). Some overlap
occurred between individual values of the two data sets, particularly with the SeaBAM
Chesapeake Bay stations (area A in the Figure) and a higher chlorophyll site in the
Canadian arctic (area B; also see Figure 3 in O’Reilly et al., 1998). Cunningham et al.
(2001) found similar divergence, using a reflectance band ratio of 443 to 555 nm, for
Scottish fjord stations with high CDOM.
Figure 28. Chl a concentration versus water column reflectance ratio (490/553 nm) for the
SEABAM data set (O’Reilly et al., 1998) used to calibrate the Ocean Color 4 (OC4) chlorophyll
algorithm for the SEAWIFS satellite (closed circles) compared with ratio calculations from 144
sites in five National Estuarine Research Reserves in the eastern United States (open circles).
The series of Case 1 and 2 water algorithms listed in Table 1 were applied to our
southeastern estuary data set. No relationships existed with any of the three Ocean
69
Optical Remote Sensing Techniques
filtered for pigment and seston analysis and filtrate was used for CDOM absorption
(Table 2). Algal pigments were extracted using 90% buffered acetone with a tissue
grinder. Spectral data were collected and processed with the CDAP software package
(CALMIT, University of Nebraska). We sampled 155 stations. Eleven stations, with
ratios of total depth to Secchi transparency less than 1.5, were eliminated from analysis
to avoid bottom reflectance biases. We measured a 600 fold range for chl a, a 200 fold
range for ABS 400 , and a 90 fold range for seston (Table 2). Correlations (r values)
between OACs were quite low: seston and chl a = 0.274, seston and ABS 440 = 0.031,
and chl a and ABS 440 = 0.045. In Figure 28, a conventional ocean color ratio (490 to
555 nm) was calculated for our data and compared to the SeaBAM data set used to
parameterize the Ocean Color 4 algorithm (O’Reilly et al., 1998; see above). In the
SeaBAM data set, the 490 to 550 nm ratio, fitted to a power function, yielded the
highest r
2 value (0.915) of any band ratio pair and regression model in the SeaBAM
data. The SeaBAM data had a strong negative correlation between the 490:555 ratio
and chl a; however, our coastal data clearly did not (Figure 28). However, when a Case
2 algorithm was applied the r
2 value was much higher (discussed below). Some overlap
occurred between individual values of the two data sets, particularly with the SeaBAM
Chesapeake Bay stations (area A in the Figure) and a higher chlorophyll site in the
Canadian arctic (area B; also see Figure 3 in O’Reilly et al., 1998). Cunningham et al.
(2001) found similar divergence, using a reflectance band ratio of 443 to 555 nm, for
Scottish fjord stations with high CDOM.
Figure 28. Chl a concentration versus water column reflectance ratio (490/553 nm) for the
SEABAM data set (O’Reilly et al., 1998) used to calibrate the Ocean Color 4 (OC4) chlorophyll
algorithm for the SEAWIFS satellite (closed circles) compared with ratio calculations from 144
sites in five National Estuarine Research Reserves in the eastern United States (open circles).
The series of Case 1 and 2 water algorithms listed in Table 1 were applied to our
southeastern estuary data set. No relationships existed with any of the three Ocean
69
Optical Remote Sensing Techniques