

6.3 CLAY INTERACTIONS WITH PHYTOPLANKTON
In a separate mesocosm experiment, algal bloom water from a single, fertilized
experimental tank was divided and added to two clean, empty 80 m
3 tanks (Schalles
et al., 1997). One third of the bloom water was added to the first tank and two thirds to
the second tank, taking care not to draw settled materials from the bottom of the
fertilized culture tank. Clear, dechlorinated water was then used to fill the remaining
volumes of the first and second experimental tanks. In this manner, algal suspensions
were established with chl a concentrations of 31 and 57 µg/l. Both tanks had identical
communities of algae, with the same age and size distributions, and the only difference
in the starting conditions of the two ponds was cell density. In this experiment, nearly
identical additions of the same white, kaolin clay used in the experiment shown in
Figure 13 were made to both tanks in a stepwise manner. Clay was added in 6
increments, and the final increment achieved a concentration of 72 mg/l dry weight in
both tanks.
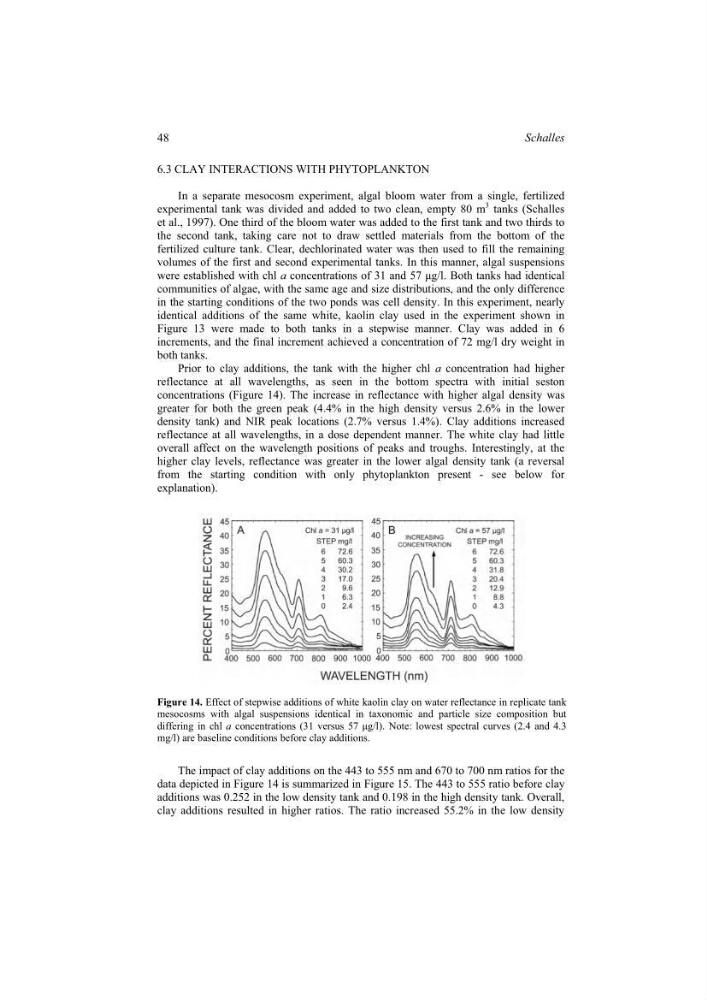
Prior to clay additions, the tank with the higher chl a concentration had higher
reflectance at all wavelengths, as seen in the bottom spectra with initial seston
concentrations (Figure 14). The increase in reflectance with higher algal density was
greater for both the green peak (4.4% in the high density versus 2.6% in the lower
density tank) and NIR peak locations (2.7% versus 1.4%). Clay additions increased
reflectance at all wavelengths, in a dose dependent manner. The white clay had little
overall affect on the wavelength positions of peaks and troughs. Interestingly, at the
higher clay levels, reflectance was greater in the lower algal density tank (a reversal
from the starting condition with only phytoplankton present - see below for
explanation).
Figure 14. Effect of stepwise additions of white kaolin clay on water reflectance in replicate tank
mesocosms with algal suspensions identical in taxonomic and particle size composition but
differing in chl a concentrations (31 versus 57 µg/l). Note: lowest spectral curves (2.4 and 4.3
mg/l) are baseline conditions before clay additions.
The impact of clay additions on the 443 to 555 nm and 670 to 700 nm ratios for the
data depicted in Figure 14 is summarized in Figure 15. The 443 to 555 ratio before clay
additions was 0.252 in the low density tank and 0.198 in the high density tank. Overall,
clay additions resulted in higher ratios. The ratio increased 55.2% in the low density
48
Schalles
In a separate mesocosm experiment, algal bloom water from a single, fertilized
experimental tank was divided and added to two clean, empty 80 m
3 tanks (Schalles
et al., 1997). One third of the bloom water was added to the first tank and two thirds to
the second tank, taking care not to draw settled materials from the bottom of the
fertilized culture tank. Clear, dechlorinated water was then used to fill the remaining
volumes of the first and second experimental tanks. In this manner, algal suspensions
were established with chl a concentrations of 31 and 57 µg/l. Both tanks had identical
communities of algae, with the same age and size distributions, and the only difference
in the starting conditions of the two ponds was cell density. In this experiment, nearly
identical additions of the same white, kaolin clay used in the experiment shown in
Figure 13 were made to both tanks in a stepwise manner. Clay was added in 6
increments, and the final increment achieved a concentration of 72 mg/l dry weight in
both tanks.
Prior to clay additions, the tank with the higher chl a concentration had higher
reflectance at all wavelengths, as seen in the bottom spectra with initial seston
concentrations (Figure 14). The increase in reflectance with higher algal density was
greater for both the green peak (4.4% in the high density versus 2.6% in the lower
density tank) and NIR peak locations (2.7% versus 1.4%). Clay additions increased
reflectance at all wavelengths, in a dose dependent manner. The white clay had little
overall affect on the wavelength positions of peaks and troughs. Interestingly, at the
higher clay levels, reflectance was greater in the lower algal density tank (a reversal
from the starting condition with only phytoplankton present - see below for
explanation).
Figure 14. Effect of stepwise additions of white kaolin clay on water reflectance in replicate tank
mesocosms with algal suspensions identical in taxonomic and particle size composition but
differing in chl a concentrations (31 versus 57 µg/l). Note: lowest spectral curves (2.4 and 4.3
mg/l) are baseline conditions before clay additions.
The impact of clay additions on the 443 to 555 nm and 670 to 700 nm ratios for the
data depicted in Figure 14 is summarized in Figure 15. The 443 to 555 ratio before clay
additions was 0.252 in the low density tank and 0.198 in the high density tank. Overall,
clay additions resulted in higher ratios. The ratio increased 55.2% in the low density
48
Schalles