

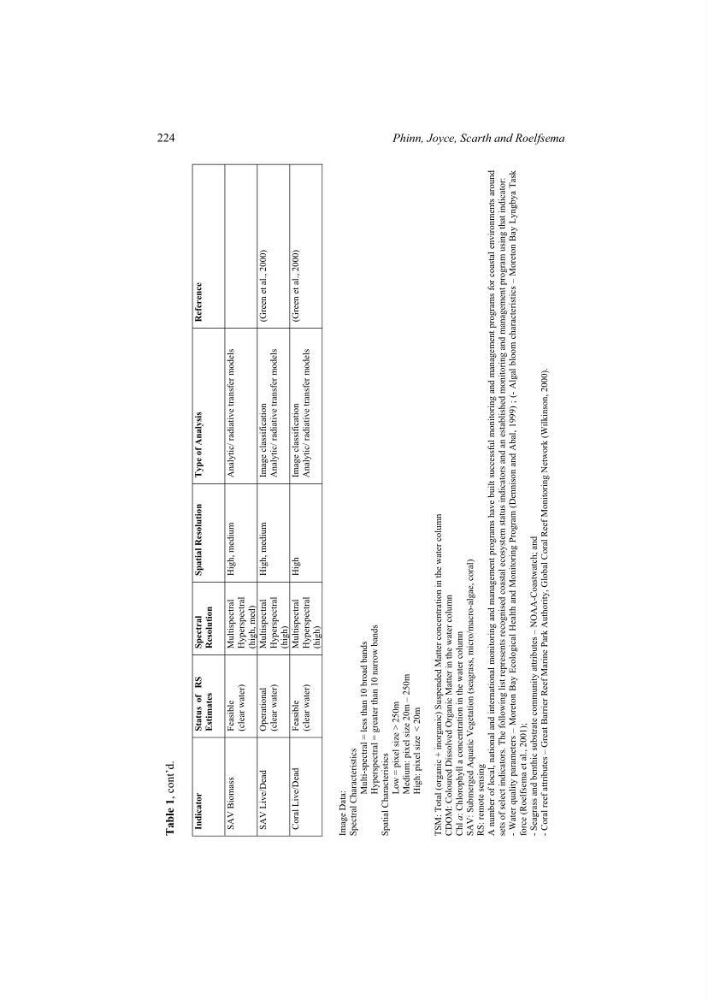
Table 1,
cont’d.
Indicator Status
of RS
Estimates
Spectral Resolution
Spatial Resolution Type of Analysis
Reference
SAV Biomass Feasible
(clear water)
Multispectral Hyperspectral
(high, med)
High, medium Analytic/ radiative transfer models
SAV Live/Dead Operational
(clear water)
Multispectral Hyperspectral
(high)
High, medium Image classification
Analytic/ radiative transfer models
(Green et al., 2000)
Coral Live/Dead Feasible
(clear water)
Multispectral Hyperspectral
(high)
High Image
classification
Analytic/ radiative transfer models
(Green et al., 2000)
Image Data:
Spectral Characteristics Multi-spectral = less than 10 broad bands
Hyperspectral = greater than 10 narrow bands
Spatial Characteristics
Low = pixel size > 250m
Medium: pixel size 20m – 250m
High: pixel size < 20m
TSM: Total (organic + inorganic) Suspended Matter concentration in the water column
CDOM: Coloured Dissolved Organic Matter in the water column
Chl
a: Chlorophyll a concentration in the water column
SAV: Submerged Aquatic Vegetation (seagrass, micro/macro-algae, coral)
RS: remote sensing
A number of local, national and international monitoring and management
programs have built successful monitoring and management
programs for coastal environments around
sets of select indicators. The following list represents
recognised coastal ecosystem status indicators and an established
monitoring and management program using that indicator:
- Water quality parameters – Moreton Bay Ecological Health
and Monitoring Program (Dennison and Abal, 1999) ; (- Algal bloom characteristics
– Moreton Bay Lyngbya Task
force (Roelfsema et al., 2001);
- Seagrass and benthic substrate community
attributes – NOAA-Coastwatch; and
- Coral reef attributes – Great Barrier Reef Marine Park Authority,
Global Coral Reef Monitoring Network (Wilkinson, 2000).
224
Phinn, Joyce, Scarth and Roelfsema
cont’d.
Indicator Status
of RS
Estimates
Spectral Resolution
Spatial Resolution Type of Analysis
Reference
SAV Biomass Feasible
(clear water)
Multispectral Hyperspectral
(high, med)
High, medium Analytic/ radiative transfer models
SAV Live/Dead Operational
(clear water)
Multispectral Hyperspectral
(high)
High, medium Image classification
Analytic/ radiative transfer models
(Green et al., 2000)
Coral Live/Dead Feasible
(clear water)
Multispectral Hyperspectral
(high)
High Image
classification
Analytic/ radiative transfer models
(Green et al., 2000)
Image Data:
Spectral Characteristics Multi-spectral = less than 10 broad bands
Hyperspectral = greater than 10 narrow bands
Spatial Characteristics
Low = pixel size > 250m
Medium: pixel size 20m – 250m
High: pixel size < 20m
TSM: Total (organic + inorganic) Suspended Matter concentration in the water column
CDOM: Coloured Dissolved Organic Matter in the water column
Chl
a: Chlorophyll a concentration in the water column
SAV: Submerged Aquatic Vegetation (seagrass, micro/macro-algae, coral)
RS: remote sensing
A number of local, national and international monitoring and management
programs have built successful monitoring and management
programs for coastal environments around
sets of select indicators. The following list represents
recognised coastal ecosystem status indicators and an established
monitoring and management program using that indicator:
- Water quality parameters – Moreton Bay Ecological Health
and Monitoring Program (Dennison and Abal, 1999) ; (- Algal bloom characteristics
– Moreton Bay Lyngbya Task
force (Roelfsema et al., 2001);
- Seagrass and benthic substrate community
attributes – NOAA-Coastwatch; and
- Coral reef attributes – Great Barrier Reef Marine Park Authority,
Global Coral Reef Monitoring Network (Wilkinson, 2000).
224
Phinn, Joyce, Scarth and Roelfsema