

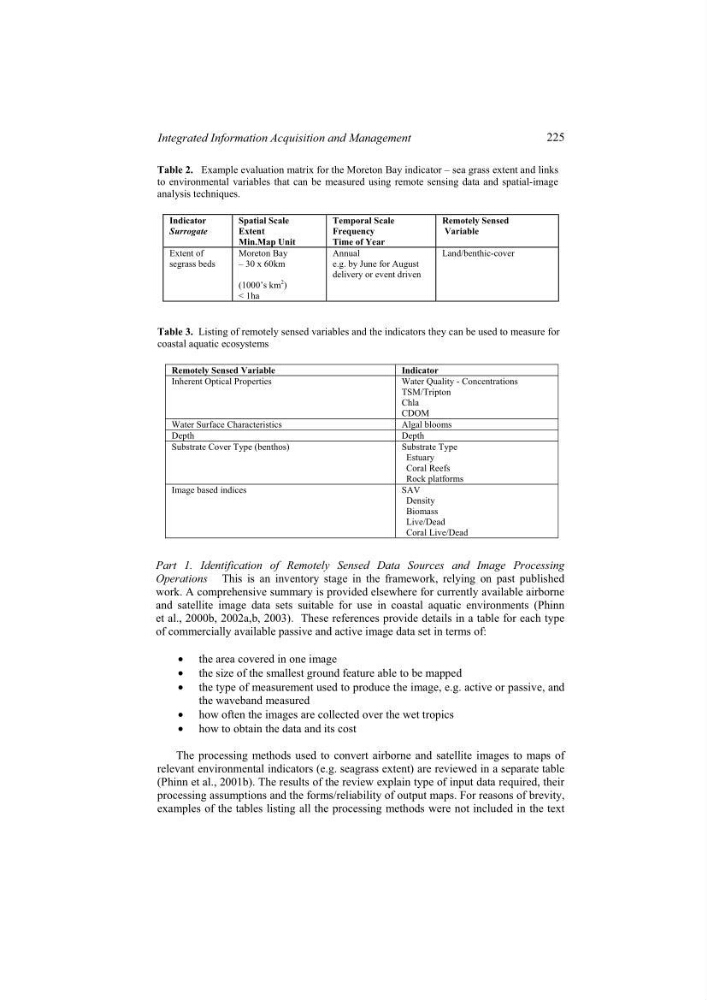
Table 2. Example evaluation matrix for the Moreton Bay indicator – sea grass extent and links
to environmental variables that can be measured using remote sensing data and spatial-image
analysis techniques.
Indicator
Surrogate
Spatial Scale
Extent
Min.Map Unit
Temporal Scale
Frequency
Time of Year
Remotely Sensed
Variable
Extent of
segrass beds
Moreton Bay
– 30 x 60km
(1000’s km
2
)
< 1ha
Annual
e.g. by June for August
delivery or event driven
Land/benthic-cover
Table 3. Listing of remotely sensed variables and the indicators they can be used to measure for
coastal aquatic ecosystems
Remotely Sensed Variable
Indicator
Inherent Optical Properties
Water Quality - Concentrations
TSM/Tripton
Chla
CDOM
Water Surface Characteristics
Algal blooms
Depth
Depth
Substrate Cover Type (benthos)
Substrate Type
Estuary
Coral Reefs
Rock platforms
Image based indices
SAV
Density
Biomass
Live/Dead
Coral Live/Dead
Part 1. Identification of Remotely Sensed Data Sources and Image Processing
Operations This is an inventory stage in the framework, relying on past published
work. A comprehensive summary is provided elsewhere for currently available airborne
and satellite image data sets suitable for use in coastal aquatic environments (Phinn
et al., 2000b, 2002a,b, 2003). These references provide details in a table for each type
of commercially available passive and active image data set in terms of:
• the area covered in one image
• the size of the smallest ground feature able to be mapped
• the type of measurement used to produce the image, e.g. active or passive, and
the waveband measured
• how often the images are collected over the wet tropics
• how to obtain the data and its cost
The processing methods used to convert airborne and satellite images to maps of
relevant environmental indicators (e.g. seagrass extent) are reviewed in a separate table
(Phinn et al., 2001b). The results of the review explain type of input data required, their
processing assumptions and the forms/reliability of output maps. For reasons of brevity,
examples of the tables listing all the processing methods were not included in the text
225
Integrated Information Acquisition and Management
to environmental variables that can be measured using remote sensing data and spatial-image
analysis techniques.
Indicator
Surrogate
Spatial Scale
Extent
Min.Map Unit
Temporal Scale
Frequency
Time of Year
Remotely Sensed
Variable
Extent of
segrass beds
Moreton Bay
– 30 x 60km
(1000’s km
2
)
< 1ha
Annual
e.g. by June for August
delivery or event driven
Land/benthic-cover
Table 3. Listing of remotely sensed variables and the indicators they can be used to measure for
coastal aquatic ecosystems
Remotely Sensed Variable
Indicator
Inherent Optical Properties
Water Quality - Concentrations
TSM/Tripton
Chla
CDOM
Water Surface Characteristics
Algal blooms
Depth
Depth
Substrate Cover Type (benthos)
Substrate Type
Estuary
Coral Reefs
Rock platforms
Image based indices
SAV
Density
Biomass
Live/Dead
Coral Live/Dead
Part 1. Identification of Remotely Sensed Data Sources and Image Processing
Operations This is an inventory stage in the framework, relying on past published
work. A comprehensive summary is provided elsewhere for currently available airborne
and satellite image data sets suitable for use in coastal aquatic environments (Phinn
et al., 2000b, 2002a,b, 2003). These references provide details in a table for each type
of commercially available passive and active image data set in terms of:
• the area covered in one image
• the size of the smallest ground feature able to be mapped
• the type of measurement used to produce the image, e.g. active or passive, and
the waveband measured
• how often the images are collected over the wet tropics
• how to obtain the data and its cost
The processing methods used to convert airborne and satellite images to maps of
relevant environmental indicators (e.g. seagrass extent) are reviewed in a separate table
(Phinn et al., 2001b). The results of the review explain type of input data required, their
processing assumptions and the forms/reliability of output maps. For reasons of brevity,
examples of the tables listing all the processing methods were not included in the text
225
Integrated Information Acquisition and Management