

were combined with the new points extracted from the non-ground file to generate a
new TIN along the waterfront (Dickie, 2001). In this case, a linear interpolation method
was used to construct a 2 m DEM. A linear interpolation was chosen to better represent
the abrupt vertical changes associated with the waterfront. The final DEM consisted of
a mosaic combining the quintic 2 m DEM for the area landward of the waterfront with
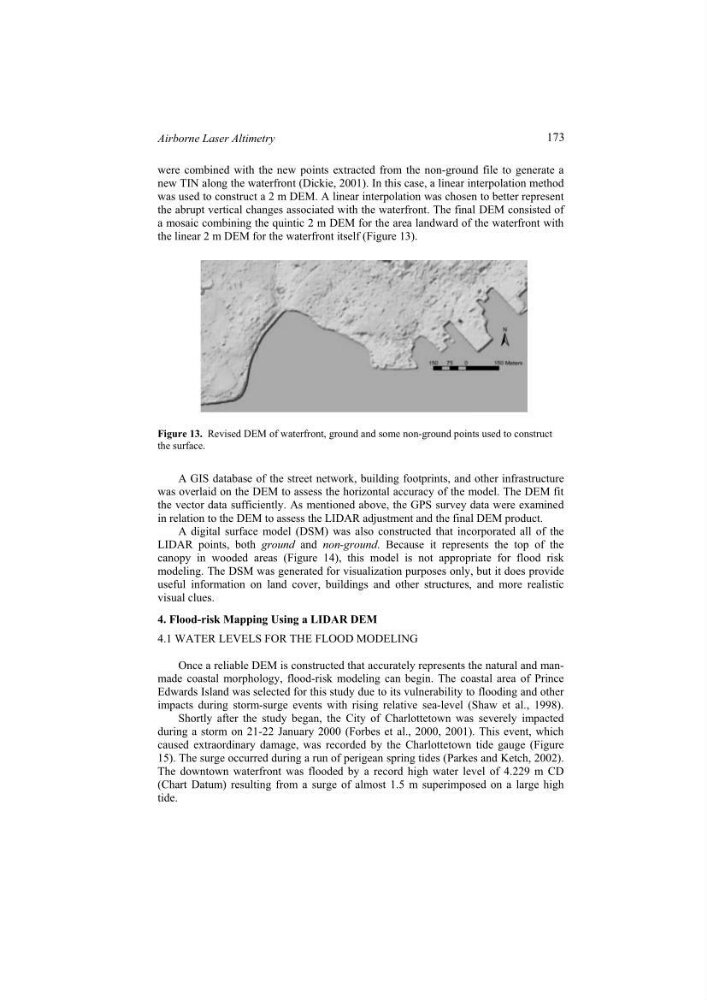
the linear 2 m DEM for the waterfront itself (Figure 13).
Figure 13. Revised DEM of waterfront, ground and some non-ground points used to construct
the surface.
A GIS database of the street network, building footprints, and other infrastructure
was overlaid on the DEM to assess the horizontal accuracy of the model. The DEM fit
the vector data sufficiently. As mentioned above, the GPS survey data were examined
in relation to the DEM to assess the LIDAR adjustment and the final DEM product.
A digital surface model (DSM) was also constructed that incorporated all of the
LIDAR points, both ground and non-ground. Because it represents the top of the
canopy in wooded areas (Figure 14), this model is not appropriate for flood risk
modeling. The DSM was generated for visualization purposes only, but it does provide
useful information on land cover, buildings and other structures, and more realistic
visual clues.
4. Flood-risk Mapping Using a LIDAR DEM
4.1 WATER LEVELS FOR THE FLOOD MODELING
Once a reliable DEM is constructed that accurately represents the natural and manmade coastal morphology, flood-risk modeling can begin. The coastal area of Prince
Edwards Island was selected for this study due to its vulnerability to flooding and other
impacts during storm-surge events with rising relative sea-level (Shaw et al., 1998).
Shortly after the study began, the City of Charlottetown was severely impacted
during a storm on 21-22 January 2000 (Forbes et al., 2000, 2001). This event, which
caused extraordinary damage, was recorded by the Charlottetown tide gauge (Figure
15). The surge occurred during a run of perigean spring tides (Parkes and Ketch, 2002).
The downtown waterfront was flooded by a record high water level of 4.229 m CD
(Chart Datum) resulting from a surge of almost 1.5 m superimposed on a large high
tide.
173
Airborne Laser Altimetry
new TIN along the waterfront (Dickie, 2001). In this case, a linear interpolation method
was used to construct a 2 m DEM. A linear interpolation was chosen to better represent
the abrupt vertical changes associated with the waterfront. The final DEM consisted of
a mosaic combining the quintic 2 m DEM for the area landward of the waterfront with
the linear 2 m DEM for the waterfront itself (Figure 13).
Figure 13. Revised DEM of waterfront, ground and some non-ground points used to construct
the surface.
A GIS database of the street network, building footprints, and other infrastructure
was overlaid on the DEM to assess the horizontal accuracy of the model. The DEM fit
the vector data sufficiently. As mentioned above, the GPS survey data were examined
in relation to the DEM to assess the LIDAR adjustment and the final DEM product.
A digital surface model (DSM) was also constructed that incorporated all of the
LIDAR points, both ground and non-ground. Because it represents the top of the
canopy in wooded areas (Figure 14), this model is not appropriate for flood risk
modeling. The DSM was generated for visualization purposes only, but it does provide
useful information on land cover, buildings and other structures, and more realistic
visual clues.
4. Flood-risk Mapping Using a LIDAR DEM
4.1 WATER LEVELS FOR THE FLOOD MODELING
Once a reliable DEM is constructed that accurately represents the natural and manmade coastal morphology, flood-risk modeling can begin. The coastal area of Prince
Edwards Island was selected for this study due to its vulnerability to flooding and other
impacts during storm-surge events with rising relative sea-level (Shaw et al., 1998).
Shortly after the study began, the City of Charlottetown was severely impacted
during a storm on 21-22 January 2000 (Forbes et al., 2000, 2001). This event, which
caused extraordinary damage, was recorded by the Charlottetown tide gauge (Figure
15). The surge occurred during a run of perigean spring tides (Parkes and Ketch, 2002).
The downtown waterfront was flooded by a record high water level of 4.229 m CD
(Chart Datum) resulting from a surge of almost 1.5 m superimposed on a large high
tide.
173
Airborne Laser Altimetry