

Figure 14. Digital Surface Model (DSM) all LIDAR points used to construct this surface.
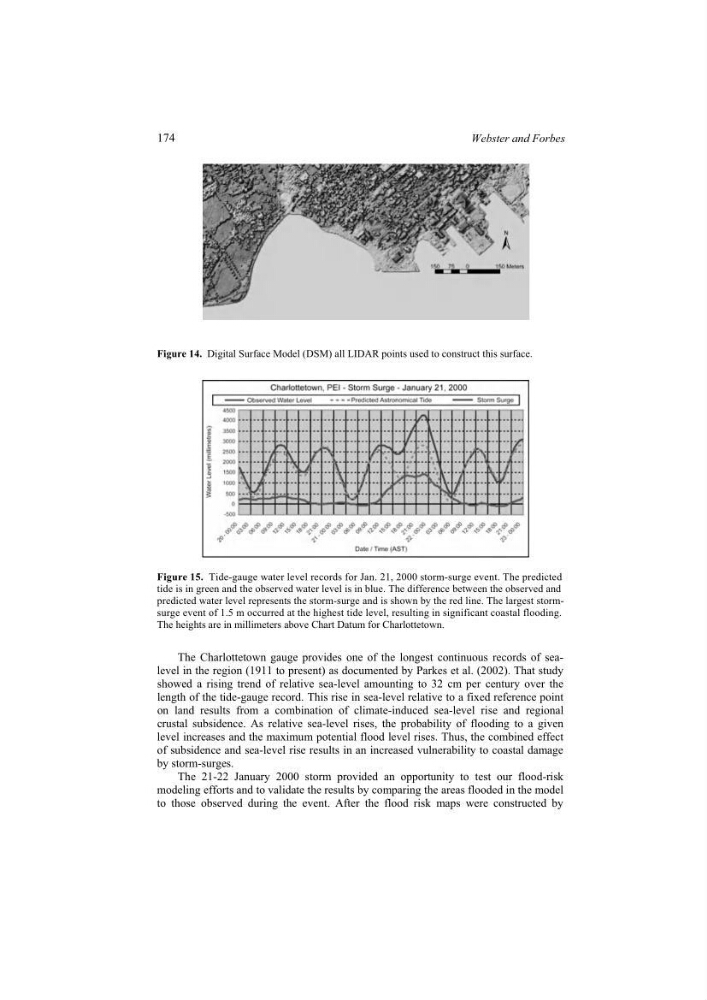
The heights are in millimeters above Chart Datum for Charlottetown.
The Charlottetown gauge provides one of the longest continuous records of sealevel in the region (1911 to present) as documented by Parkes et al. (2002). That study
showed a rising trend of relative sea-level amounting to 32 cm per century over the
length of the tide-gauge record. This rise in sea-level relative to a fixed reference point
on land results from a combination of climate-induced sea-level rise and regional
crustal subsidence. As relative sea-level rises, the probability of flooding to a given
level increases and the maximum potential flood level rises. Thus, the combined effect
of subsidence and sea-level rise results in an increased vulnerability to coastal damage
by storm-surges.
The 21-22 January 2000 storm provided an opportunity to test our flood-risk
modeling efforts and to validate the results by comparing the areas flooded in the model
to those observed during the event. After the flood risk maps were constructed by
Figure 15. Tide-gauge water level records for Jan. 21, 2000 storm-surge event. The predicted
tide is in green and the observed water level is in blue. The difference between the observed and
predicted water level represents the storm-surge and is shown by the red line. The largest stormsurge event of 1.5 m occurred at the highest tide level, resulting in significant coastal flooding.
174
Webster and Forbes
The heights are in millimeters above Chart Datum for Charlottetown.
The Charlottetown gauge provides one of the longest continuous records of sealevel in the region (1911 to present) as documented by Parkes et al. (2002). That study
showed a rising trend of relative sea-level amounting to 32 cm per century over the
length of the tide-gauge record. This rise in sea-level relative to a fixed reference point
on land results from a combination of climate-induced sea-level rise and regional
crustal subsidence. As relative sea-level rises, the probability of flooding to a given
level increases and the maximum potential flood level rises. Thus, the combined effect
of subsidence and sea-level rise results in an increased vulnerability to coastal damage
by storm-surges.
The 21-22 January 2000 storm provided an opportunity to test our flood-risk
modeling efforts and to validate the results by comparing the areas flooded in the model
to those observed during the event. After the flood risk maps were constructed by
Figure 15. Tide-gauge water level records for Jan. 21, 2000 storm-surge event. The predicted
tide is in green and the observed water level is in blue. The difference between the observed and
predicted water level represents the storm-surge and is shown by the red line. The largest stormsurge event of 1.5 m occurred at the highest tide level, resulting in significant coastal flooding.
174
Webster and Forbes