

x
the TIN interpolation crossed areas of no data, such as the inner gap in the ‘V’
shape of the study area (Figure 1) and sparse data points in the water, thus
producing a surface in these areas that was not reliable; and
x
wharves and sea walls with vertical faces along the waterfront appeared in the
shaded-relief image to have slanted sides (Dickie, 2001).
3.2 GROUND SURFACE REFINEMENT
The problem of inaccurate surface interpolation across areas of no valid data can be
resolved by clipping the grid using a mask covering only the areas of interest. This is
also required along the shoreline to exclude water surface returns. Complications can
develop where the area of interest is large, as in the North Shore survey area, and there
are significant variations in tide level during the survey or hydraulic effects causing
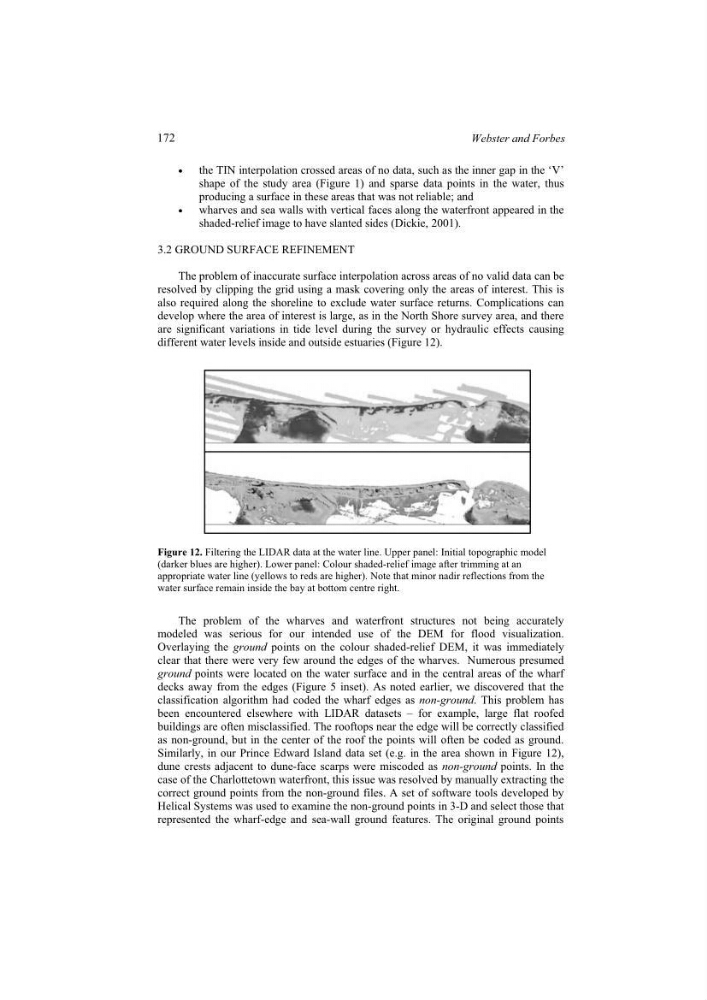
different water levels inside and outside estuaries (Figure 12).
Figure 12. Filtering the LIDAR data at the water line. Upper panel: Initial topographic model
(darker blues are higher). Lower panel: Colour shaded-relief image after trimming at an
appropriate water line (yellows to reds are higher). Note that minor nadir reflections from the
water surface remain inside the bay at bottom centre right.
The problem of the wharves and waterfront structures not being accurately
modeled was serious for our intended use of the DEM for flood visualization.
Overlaying the ground points on the colour shaded-relief DEM, it was immediately
clear that there were very few around the edges of the wharves. Numerous presumed
ground points were located on the water surface and in the central areas of the wharf
decks away from the edges (Figure 5 inset). As noted earlier, we discovered that the
classification algorithm had coded the wharf edges as non-ground. This problem has
been encountered elsewhere with LIDAR datasets – for example, large flat roofed
buildings are often misclassified. The rooftops near the edge will be correctly classified
as non-ground, but in the center of the roof the points will often be coded as ground.
Similarly, in our Prince Edward Island data set (e.g. in the area shown in Figure 12),
dune crests adjacent to dune-face scarps were miscoded as non-ground points. In the
case of the Charlottetown waterfront, this issue was resolved by manually extracting the
correct ground points from the non-ground files. A set of software tools developed by
Helical Systems was used to examine the non-ground points in 3-D and select those that
represented the wharf-edge and sea-wall ground features. The original ground points
172
Webster and Forbes
the TIN interpolation crossed areas of no data, such as the inner gap in the ‘V’
shape of the study area (Figure 1) and sparse data points in the water, thus
producing a surface in these areas that was not reliable; and
x
wharves and sea walls with vertical faces along the waterfront appeared in the
shaded-relief image to have slanted sides (Dickie, 2001).
3.2 GROUND SURFACE REFINEMENT
The problem of inaccurate surface interpolation across areas of no valid data can be
resolved by clipping the grid using a mask covering only the areas of interest. This is
also required along the shoreline to exclude water surface returns. Complications can
develop where the area of interest is large, as in the North Shore survey area, and there
are significant variations in tide level during the survey or hydraulic effects causing
different water levels inside and outside estuaries (Figure 12).
Figure 12. Filtering the LIDAR data at the water line. Upper panel: Initial topographic model
(darker blues are higher). Lower panel: Colour shaded-relief image after trimming at an
appropriate water line (yellows to reds are higher). Note that minor nadir reflections from the
water surface remain inside the bay at bottom centre right.
The problem of the wharves and waterfront structures not being accurately
modeled was serious for our intended use of the DEM for flood visualization.
Overlaying the ground points on the colour shaded-relief DEM, it was immediately
clear that there were very few around the edges of the wharves. Numerous presumed
ground points were located on the water surface and in the central areas of the wharf
decks away from the edges (Figure 5 inset). As noted earlier, we discovered that the
classification algorithm had coded the wharf edges as non-ground. This problem has
been encountered elsewhere with LIDAR datasets – for example, large flat roofed
buildings are often misclassified. The rooftops near the edge will be correctly classified
as non-ground, but in the center of the roof the points will often be coded as ground.
Similarly, in our Prince Edward Island data set (e.g. in the area shown in Figure 12),
dune crests adjacent to dune-face scarps were miscoded as non-ground points. In the
case of the Charlottetown waterfront, this issue was resolved by manually extracting the
correct ground points from the non-ground files. A set of software tools developed by
Helical Systems was used to examine the non-ground points in 3-D and select those that
represented the wharf-edge and sea-wall ground features. The original ground points
172
Webster and Forbes