

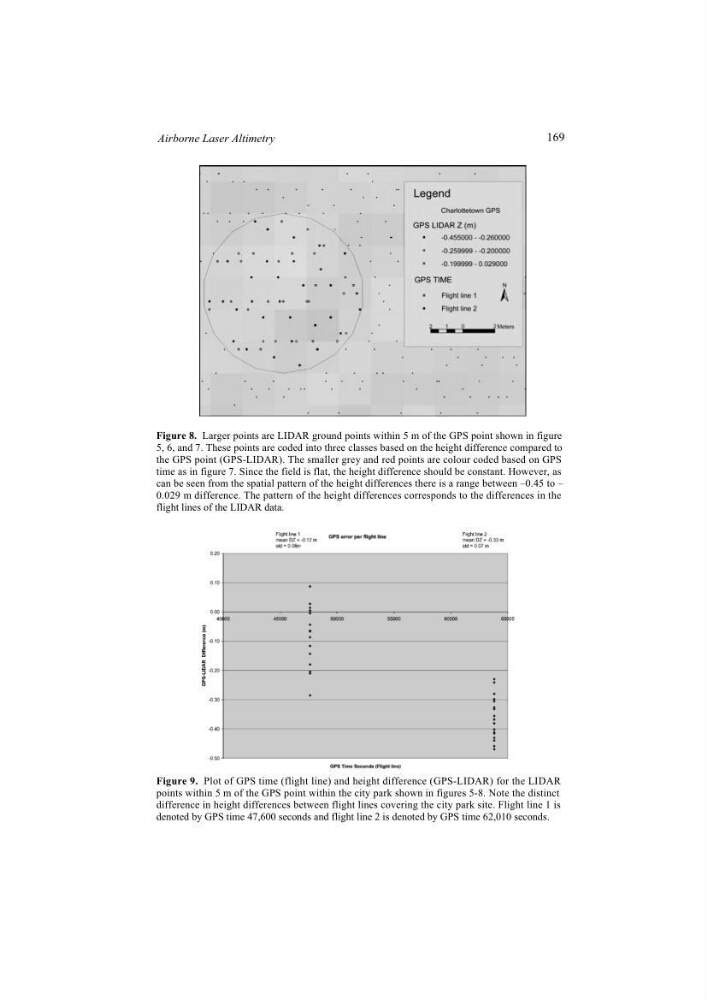
flight lines of the LIDAR data.
denoted by GPS time 47,600 seconds and flight line 2 is denoted by GPS time 62,010 seconds.
Figure 8. Larger points are LIDAR ground points within 5 m of the GPS point shown in figure
5, 6, and 7. These points are coded into three classes based on the height difference compared to
the GPS point (GPS-LIDAR). The smaller grey and red points are colour coded based on GPS
time as in figure 7. Since the field is flat, the height difference should be constant. However, as
can be seen from the spatial pattern of the height differences there is a range between –0.45 to –
0.029 m difference. The pattern of the height differences corresponds to the differences in the
Figure 9. Plot of GPS time (flight line) and height difference (GPS-LIDAR) for the LIDAR
points within 5 m of the GPS point within the city park shown in figures 5-8. Note the distinct
difference in height differences between flight lines covering the city park site. Flight line 1 is
169
Airborne Laser Altimetry
denoted by GPS time 47,600 seconds and flight line 2 is denoted by GPS time 62,010 seconds.
Figure 8. Larger points are LIDAR ground points within 5 m of the GPS point shown in figure
5, 6, and 7. These points are coded into three classes based on the height difference compared to
the GPS point (GPS-LIDAR). The smaller grey and red points are colour coded based on GPS
time as in figure 7. Since the field is flat, the height difference should be constant. However, as
can be seen from the spatial pattern of the height differences there is a range between –0.45 to –
0.029 m difference. The pattern of the height differences corresponds to the differences in the
Figure 9. Plot of GPS time (flight line) and height difference (GPS-LIDAR) for the LIDAR
points within 5 m of the GPS point within the city park shown in figures 5-8. Note the distinct
difference in height differences between flight lines covering the city park site. Flight line 1 is
169
Airborne Laser Altimetry