

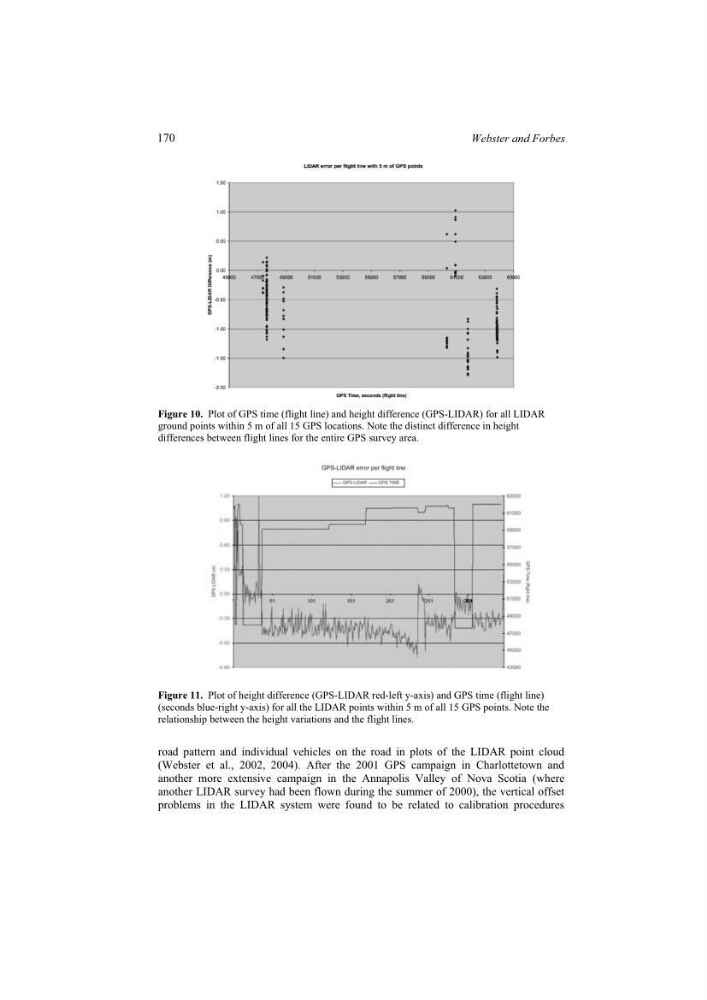
Figure 10. Plot of GPS time (flight line) and height difference (GPS-LIDAR) for all LIDAR
ground points within 5 m of all 15 GPS locations. Note the distinct difference in height
differences between flight lines for the entire GPS survey area.
Figure 11. Plot of height difference (GPS-LIDAR red-left y-axis) and GPS time (flight line)
(seconds blue-right y-axis) for all the LIDAR points within 5 m of all 15 GPS points. Note the
relationship between the height variations and the flight lines.
road pattern and individual vehicles on the road in plots of the LIDAR point cloud
(Webster et al., 2002, 2004). After the 2001 GPS campaign in Charlottetown and
another more extensive campaign in the Annapolis Valley of Nova Scotia (where
another LIDAR survey had been flown during the summer of 2000), the vertical offset
problems in the LIDAR system were found to be related to calibration procedures
170
Webster and Forbes
ground points within 5 m of all 15 GPS locations. Note the distinct difference in height
differences between flight lines for the entire GPS survey area.
Figure 11. Plot of height difference (GPS-LIDAR red-left y-axis) and GPS time (flight line)
(seconds blue-right y-axis) for all the LIDAR points within 5 m of all 15 GPS points. Note the
relationship between the height variations and the flight lines.
road pattern and individual vehicles on the road in plots of the LIDAR point cloud
(Webster et al., 2002, 2004). After the 2001 GPS campaign in Charlottetown and
another more extensive campaign in the Annapolis Valley of Nova Scotia (where
another LIDAR survey had been flown during the summer of 2000), the vertical offset
problems in the LIDAR system were found to be related to calibration procedures
170
Webster and Forbes