

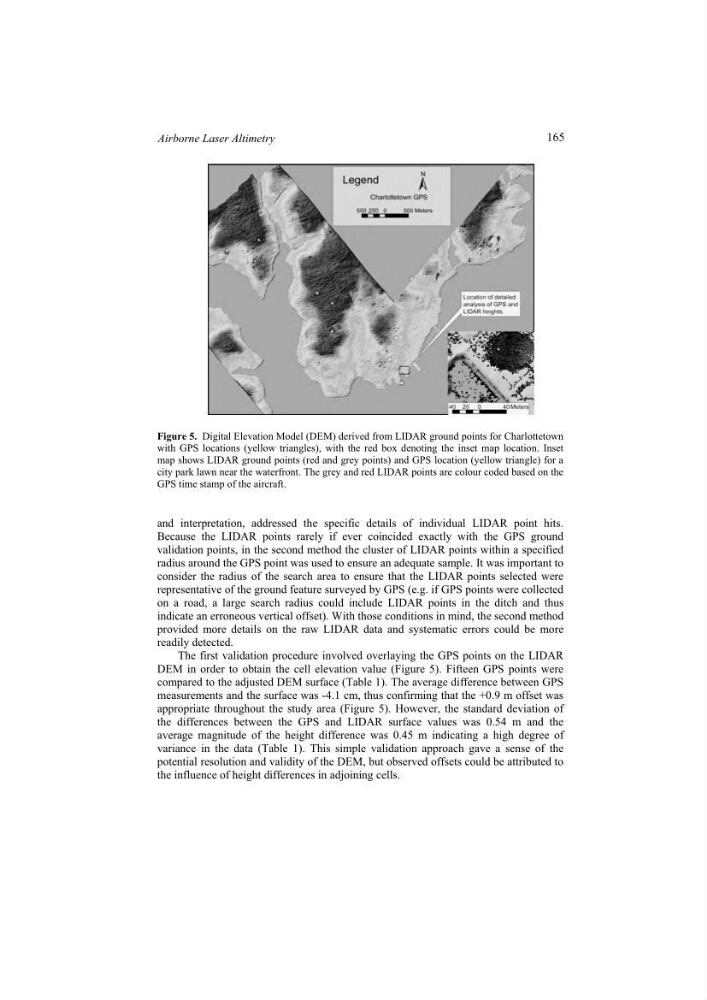
Figure 5. Digital Elevation Model (DEM) derived from LIDAR ground points for Charlottetown
with GPS locations (yellow triangles), with the red box denoting the inset map location. Inset
map shows LIDAR ground points (red and grey points) and GPS location (yellow triangle) for a
city park lawn near the waterfront. The grey and red LIDAR points are colour coded based on the
GPS time stamp of the aircraft.
and interpretation, addressed the specific details of individual LIDAR point hits.
Because the LIDAR points rarely if ever coincided exactly with the GPS ground
validation points, in the second method the cluster of LIDAR points within a specified
radius around the GPS point was used to ensure an adequate sample. It was important to
consider the radius of the search area to ensure that the LIDAR points selected were
representative of the ground feature surveyed by GPS (e.g. if GPS points were collected
on a road, a large search radius could include LIDAR points in the ditch and thus
indicate an erroneous vertical offset). With those conditions in mind, the second method
provided more details on the raw LIDAR data and systematic errors could be more
readily detected.
The first validation procedure involved overlaying the GPS points on the LIDAR
DEM in order to obtain the cell elevation value (Figure 5). Fifteen GPS points were
compared to the adjusted DEM surface (Table 1). The average difference between GPS
measurements and the surface was -4.1 cm, thus confirming that the +0.9 m offset was
appropriate throughout the study area (Figure 5). However, the standard deviation of
the differences between the GPS and LIDAR surface values was 0.54 m and the
average magnitude of the height difference was 0.45 m indicating a high degree of
variance in the data (Table 1). This simple validation approach gave a sense of the
potential resolution and validity of the DEM, but observed offsets could be attributed to
the influence of height differences in adjoining cells.
165
Airborne Laser Altimetry
with GPS locations (yellow triangles), with the red box denoting the inset map location. Inset
map shows LIDAR ground points (red and grey points) and GPS location (yellow triangle) for a
city park lawn near the waterfront. The grey and red LIDAR points are colour coded based on the
GPS time stamp of the aircraft.
and interpretation, addressed the specific details of individual LIDAR point hits.
Because the LIDAR points rarely if ever coincided exactly with the GPS ground
validation points, in the second method the cluster of LIDAR points within a specified
radius around the GPS point was used to ensure an adequate sample. It was important to
consider the radius of the search area to ensure that the LIDAR points selected were
representative of the ground feature surveyed by GPS (e.g. if GPS points were collected
on a road, a large search radius could include LIDAR points in the ditch and thus
indicate an erroneous vertical offset). With those conditions in mind, the second method
provided more details on the raw LIDAR data and systematic errors could be more
readily detected.
The first validation procedure involved overlaying the GPS points on the LIDAR
DEM in order to obtain the cell elevation value (Figure 5). Fifteen GPS points were
compared to the adjusted DEM surface (Table 1). The average difference between GPS
measurements and the surface was -4.1 cm, thus confirming that the +0.9 m offset was
appropriate throughout the study area (Figure 5). However, the standard deviation of
the differences between the GPS and LIDAR surface values was 0.54 m and the
average magnitude of the height difference was 0.45 m indicating a high degree of
variance in the data (Table 1). This simple validation approach gave a sense of the
potential resolution and validity of the DEM, but observed offsets could be attributed to
the influence of height differences in adjoining cells.
165
Airborne Laser Altimetry