

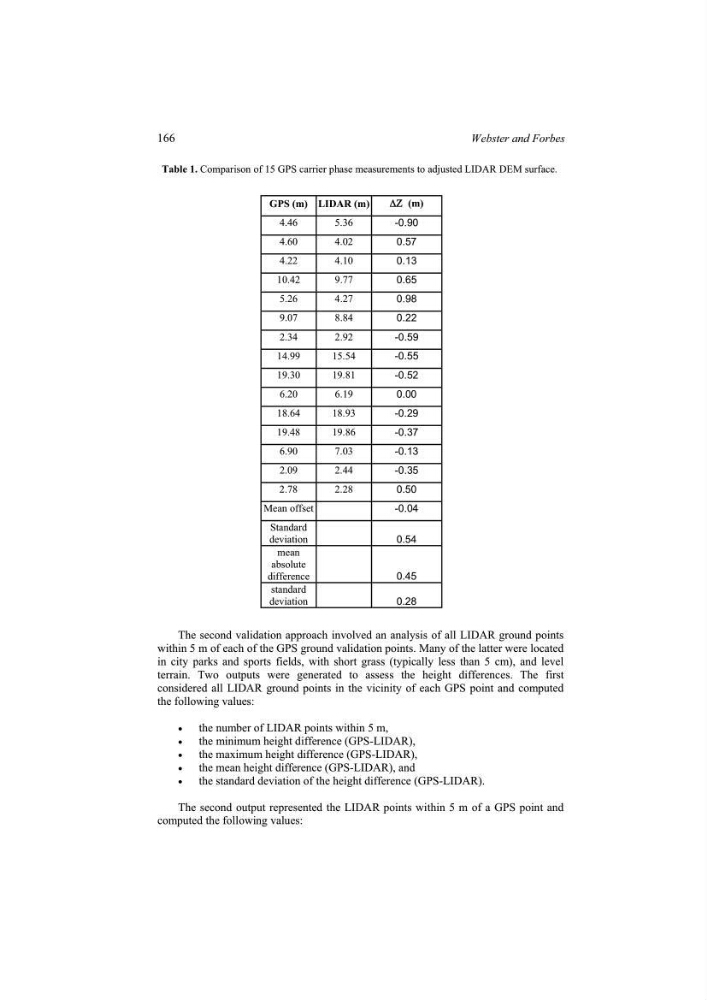
Table 1. Comparison of 15 GPS carrier phase measurements to adjusted LIDAR DEM surface.
GPS (m) LIDAR (m)
'= (m)
4.46
5.36
-0.90
4.60
4.02
0.57
4.22
4.10
0.13
10.42
9.77
0.65
5.26
4.27
0.98
9.07
8.84
0.22
2.34
2.92
-0.59
14.99
15.54
-0.55
19.30
19.81
-0.52
6.20
6.19
0.00
18.64
18.93
-0.29
19.48
19.86
-0.37
6.90
7.03
-0.13
2.09
2.44
-0.35
2.78
2.28
0.50
Mean offset
-0.04
Standard
deviation
0.54
mean
absolute
difference
0.45
standard
deviation
0.28
The second validation approach involved an analysis of all LIDAR ground points
within 5 m of each of the GPS ground validation points. Many of the latter were located
in city parks and sports fields, with short grass (typically less than 5 cm), and level
terrain. Two outputs were generated to assess the height differences. The first
considered all LIDAR ground points in the vicinity of each GPS point and computed
the following values:
x
the number of LIDAR points within 5 m,
x
the minimum height difference (GPS-LIDAR),
x
the maximum height difference (GPS-LIDAR),
x
the mean height difference (GPS-LIDAR), and
x
the standard deviation of the height difference (GPS-LIDAR).
The second output represented the LIDAR points within 5 m of a GPS point and
computed the following values:
166
Webster and Forbes
GPS (m) LIDAR (m)
'= (m)
4.46
5.36
-0.90
4.60
4.02
0.57
4.22
4.10
0.13
10.42
9.77
0.65
5.26
4.27
0.98
9.07
8.84
0.22
2.34
2.92
-0.59
14.99
15.54
-0.55
19.30
19.81
-0.52
6.20
6.19
0.00
18.64
18.93
-0.29
19.48
19.86
-0.37
6.90
7.03
-0.13
2.09
2.44
-0.35
2.78
2.28
0.50
Mean offset
-0.04
Standard
deviation
0.54
mean
absolute
difference
0.45
standard
deviation
0.28
The second validation approach involved an analysis of all LIDAR ground points
within 5 m of each of the GPS ground validation points. Many of the latter were located
in city parks and sports fields, with short grass (typically less than 5 cm), and level
terrain. Two outputs were generated to assess the height differences. The first
considered all LIDAR ground points in the vicinity of each GPS point and computed
the following values:
x
the number of LIDAR points within 5 m,
x
the minimum height difference (GPS-LIDAR),
x
the maximum height difference (GPS-LIDAR),
x
the mean height difference (GPS-LIDAR), and
x
the standard deviation of the height difference (GPS-LIDAR).
The second output represented the LIDAR points within 5 m of a GPS point and
computed the following values:
166
Webster and Forbes