

7.3.2 Bio-Optical Inversion
Once R rs (k) is derived from q t (k) through atmospheric correction, the next step is
to derive Chl from R rs (k) through bio-optical inversion (Fig. 7.2). Two general
approaches have been developed and applied to satellite data for the inversion:
empirical regression and semi-analytical modeling.
The earliest empirical inversion used a blue/green band ratio (Clarke et al.
1970; Morel and Prieur 1977), that was later applied to CZCS data by Gordon and
Clark (1980), Smith and Baker (1982), and others. The approach took the following form:
Chl ¼ AR
B ;
ð7:8Þ
where A and B are regression coefficients (constants) and R is the ratio of
reflectance or radiance at 443 or 520 to that at 550 nm. The rationale for using a
blue/green band ratio to derive Chl was simple: as the green pigment, Chl, is
increased, its strong absorption in the blue shifts the reflectance from blue toward
green wavelengths. The CZCS algorithm switched from 443 to 520 as radiance in
the 443 band diminished due to strong Chl absorption. The band at 550 nm was
chosen because it is located in a stable spectral region minimally affected by Chl.
Furthermore, by using a ratio of bands, extraneous effects (e.g. the G factor in
Eq. 7.3) tend to cancel one another. This rationale has also been used for modern
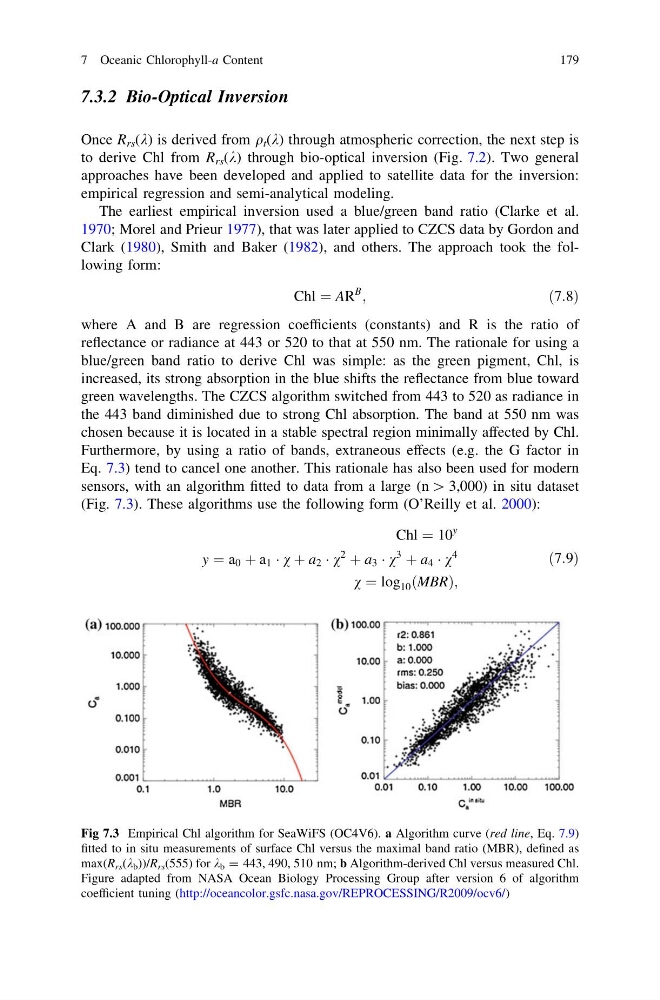
sensors, with an algorithm fitted to data from a large (n [ 3,000) in situ dataset
(Fig. 7.3). These algorithms use the following form (O’Reilly et al. 2000):
Chl ¼ 10
y
y ¼ a 0 þ a 1 Á v þ a 2 Á v
2 þ a 3 Á v
3 þ a 4 Á v
4
v ¼ log 10 MBR
ð
Þ;
ð7:9Þ
Fig 7.3 Empirical Chl algorithm for SeaWiFS (OC4V6). a Algorithm curve (red line, Eq. 7.9)
fitted to in situ measurements of surface Chl versus the maximal band ratio (MBR), defined as
max(R rs (k b ))/R rs (555) for k b = 443, 490, 510 nm; b Algorithm-derived Chl versus measured Chl.
Figure adapted from NASA Ocean Biology Processing Group after version 6 of algorithm
coefficient tuning (http://oceancolor.gsfc.nasa.gov/REPROCESSING/R2009/ocv6/)
7 Oceanic Chlorophyll-a Content
179
Once R rs (k) is derived from q t (k) through atmospheric correction, the next step is
to derive Chl from R rs (k) through bio-optical inversion (Fig. 7.2). Two general
approaches have been developed and applied to satellite data for the inversion:
empirical regression and semi-analytical modeling.
The earliest empirical inversion used a blue/green band ratio (Clarke et al.
1970; Morel and Prieur 1977), that was later applied to CZCS data by Gordon and
Clark (1980), Smith and Baker (1982), and others. The approach took the following form:
Chl ¼ AR
B ;
ð7:8Þ
where A and B are regression coefficients (constants) and R is the ratio of
reflectance or radiance at 443 or 520 to that at 550 nm. The rationale for using a
blue/green band ratio to derive Chl was simple: as the green pigment, Chl, is
increased, its strong absorption in the blue shifts the reflectance from blue toward
green wavelengths. The CZCS algorithm switched from 443 to 520 as radiance in
the 443 band diminished due to strong Chl absorption. The band at 550 nm was
chosen because it is located in a stable spectral region minimally affected by Chl.
Furthermore, by using a ratio of bands, extraneous effects (e.g. the G factor in
Eq. 7.3) tend to cancel one another. This rationale has also been used for modern
sensors, with an algorithm fitted to data from a large (n [ 3,000) in situ dataset
(Fig. 7.3). These algorithms use the following form (O’Reilly et al. 2000):
Chl ¼ 10
y
y ¼ a 0 þ a 1 Á v þ a 2 Á v
2 þ a 3 Á v
3 þ a 4 Á v
4
v ¼ log 10 MBR
ð
Þ;
ð7:9Þ
Fig 7.3 Empirical Chl algorithm for SeaWiFS (OC4V6). a Algorithm curve (red line, Eq. 7.9)
fitted to in situ measurements of surface Chl versus the maximal band ratio (MBR), defined as
max(R rs (k b ))/R rs (555) for k b = 443, 490, 510 nm; b Algorithm-derived Chl versus measured Chl.
Figure adapted from NASA Ocean Biology Processing Group after version 6 of algorithm
coefficient tuning (http://oceancolor.gsfc.nasa.gov/REPROCESSING/R2009/ocv6/)
7 Oceanic Chlorophyll-a Content
179