

likely overestimates the magnitude of the U.S. carbon sink. Wiedinmyer and Neff
(2007) estimated that wildfire in the U.S. released 0.06 Pg C year
-1 . With fire
emissions deducted, the EC-MOD estimate for the magnitude of the U.S. carbon
sink is 0.48 Pg C year
-1 over the period 2001–2009. This estimate is within the
range (0.30–0.58 g C year
-1 ) estimated by Pacala et al. (2001) and almost identical
with the estimate (0.49 Pg C year
-1 ) by the first North American State of the
Carbon Cycle Report (SOCCR 2007).
6.5.3 Interannual Variability of NEE
The anomalies of annual NEE were calculated for each year relative to the 9-year
mean (2001–2009) to examine the interannual variability of NEE. The NEE of
terrestrial ecosystems exhibits large interannual variability over the 9-year period.
Figure 6.7 shows the anomalies of annual NEE for 2002. The sign and magnitude
of the anomalies vary over space. The Great Plains and some regions in the
Midwest exhibit large positive anomalies, indicating reduced carbon uptake or net
carbon release. Some regions in the eastern U.S., including Minnesota, Kentucky,
and Tennessee, exhibit large negative anomalies, indicating increased net carbon
uptake. The remaining regions large exhibit small anomalies.
The annual NEE of U.S. terrestrial ecosystems varies from year to year
(Fig. 6.8). The annual NEE of the U.S. terrestrial ecosystems varies between
-0.77 and -1.09 Pg C year
-1 over the period 2001–2009. During the 9 years,
2009 had the lowest net carbon uptake (-0.77 Pg C year
-1 ), followed by 2002 and
2006 (-0.90 and -0.89 Pg C year
-1 , respectively). The annual NEE in 2009 was
20.6 % lower than the 9-year mean (-0.97 Pg C year
-1 ) and 29.4 % lower than
EF DF MF Sh Sa Gr Cr Natural
−0.6
−0.5
−0.4
−0.3
−0.2
−0.1
0
0.1
Vegetation type
Mean annual NEE
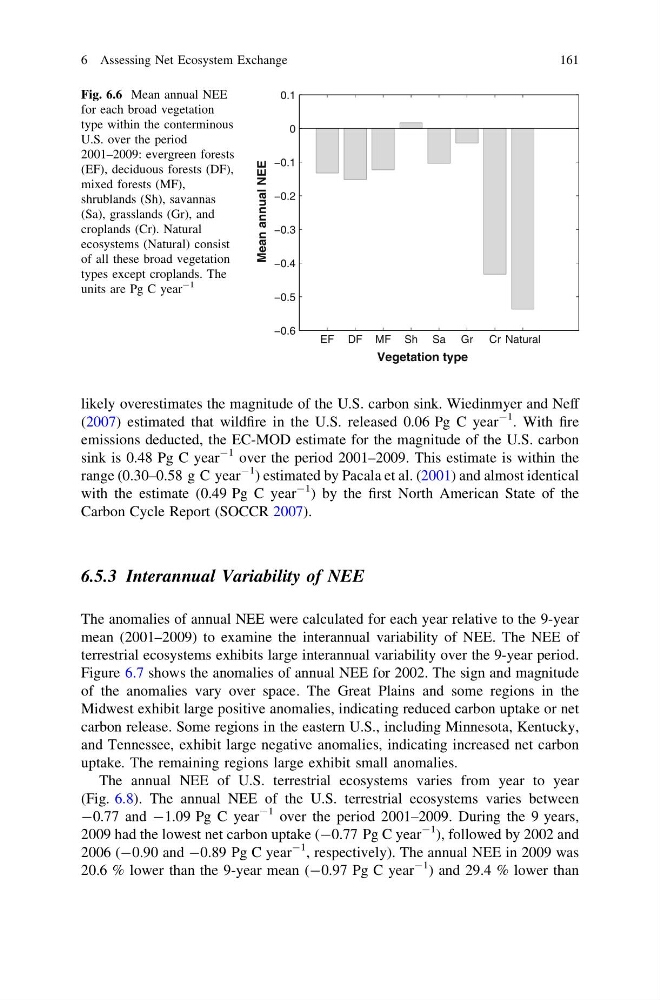
Fig. 6.6 Mean annual NEE
for each broad vegetation
type within the conterminous
U.S. over the period
2001–2009: evergreen forests
(EF), deciduous forests (DF),
mixed forests (MF),
shrublands (Sh), savannas
(Sa), grasslands (Gr), and
croplands (Cr). Natural
ecosystems (Natural) consist
of all these broad vegetation
types except croplands. The
units are Pg C year
-1
6 Assessing Net Ecosystem Exchange
161
(2007) estimated that wildfire in the U.S. released 0.06 Pg C year
-1 . With fire
emissions deducted, the EC-MOD estimate for the magnitude of the U.S. carbon
sink is 0.48 Pg C year
-1 over the period 2001–2009. This estimate is within the
range (0.30–0.58 g C year
-1 ) estimated by Pacala et al. (2001) and almost identical
with the estimate (0.49 Pg C year
-1 ) by the first North American State of the
Carbon Cycle Report (SOCCR 2007).
6.5.3 Interannual Variability of NEE
The anomalies of annual NEE were calculated for each year relative to the 9-year
mean (2001–2009) to examine the interannual variability of NEE. The NEE of
terrestrial ecosystems exhibits large interannual variability over the 9-year period.
Figure 6.7 shows the anomalies of annual NEE for 2002. The sign and magnitude
of the anomalies vary over space. The Great Plains and some regions in the
Midwest exhibit large positive anomalies, indicating reduced carbon uptake or net
carbon release. Some regions in the eastern U.S., including Minnesota, Kentucky,
and Tennessee, exhibit large negative anomalies, indicating increased net carbon
uptake. The remaining regions large exhibit small anomalies.
The annual NEE of U.S. terrestrial ecosystems varies from year to year
(Fig. 6.8). The annual NEE of the U.S. terrestrial ecosystems varies between
-0.77 and -1.09 Pg C year
-1 over the period 2001–2009. During the 9 years,
2009 had the lowest net carbon uptake (-0.77 Pg C year
-1 ), followed by 2002 and
2006 (-0.90 and -0.89 Pg C year
-1 , respectively). The annual NEE in 2009 was
20.6 % lower than the 9-year mean (-0.97 Pg C year
-1 ) and 29.4 % lower than
EF DF MF Sh Sa Gr Cr Natural
−0.6
−0.5
−0.4
−0.3
−0.2
−0.1
0
0.1
Vegetation type
Mean annual NEE
Fig. 6.6 Mean annual NEE
for each broad vegetation
type within the conterminous
U.S. over the period
2001–2009: evergreen forests
(EF), deciduous forests (DF),
mixed forests (MF),
shrublands (Sh), savannas
(Sa), grasslands (Gr), and
croplands (Cr). Natural
ecosystems (Natural) consist
of all these broad vegetation
types except croplands. The
units are Pg C year
-1
6 Assessing Net Ecosystem Exchange
161