

6.5.2 Annual NEE
The 8-day NEE estimates were aggregated to the annual scale for each year from
2001 to 2009, and mean annual NEE was then calculated for the 9-year period
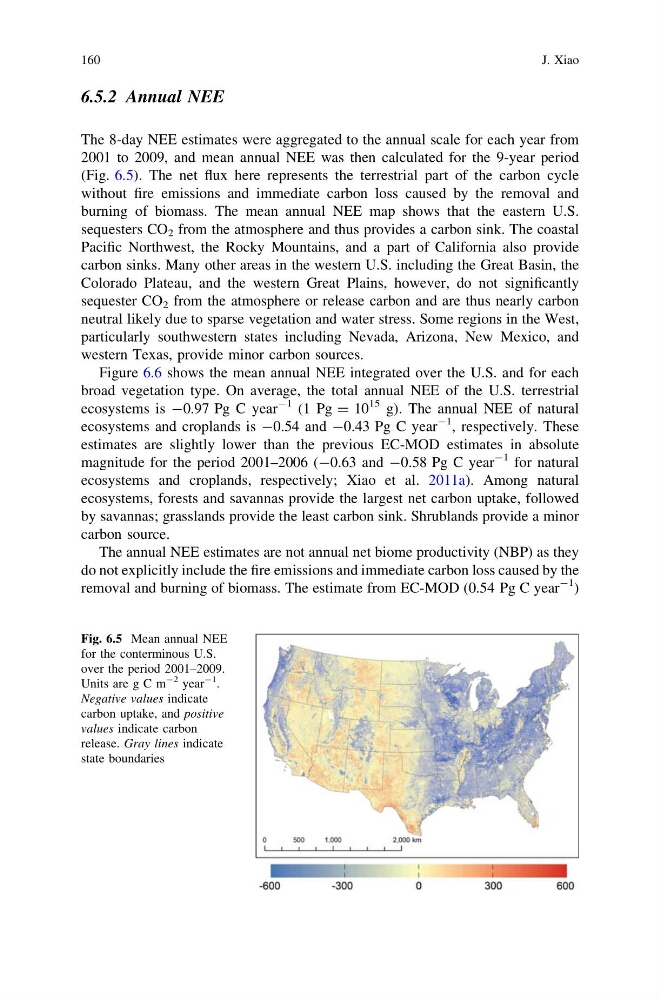
(Fig. 6.5). The net flux here represents the terrestrial part of the carbon cycle
without fire emissions and immediate carbon loss caused by the removal and
burning of biomass. The mean annual NEE map shows that the eastern U.S.
sequesters CO 2 from the atmosphere and thus provides a carbon sink. The coastal
Pacific Northwest, the Rocky Mountains, and a part of California also provide
carbon sinks. Many other areas in the western U.S. including the Great Basin, the
Colorado Plateau, and the western Great Plains, however, do not significantly
sequester CO 2 from the atmosphere or release carbon and are thus nearly carbon
neutral likely due to sparse vegetation and water stress. Some regions in the West,
particularly southwestern states including Nevada, Arizona, New Mexico, and
western Texas, provide minor carbon sources.
Figure 6.6 shows the mean annual NEE integrated over the U.S. and for each
broad vegetation type. On average, the total annual NEE of the U.S. terrestrial
ecosystems is -0.97 Pg C year
-1 (1 Pg = 10
15 g). The annual NEE of natural
ecosystems and croplands is -0.54 and -0.43 Pg C year
-1 , respectively. These
estimates are slightly lower than the previous EC-MOD estimates in absolute
magnitude for the period 2001–2006 (-0.63 and -0.58 Pg C year
-1 for natural
ecosystems and croplands, respectively; Xiao et al. 2011a). Among natural
ecosystems, forests and savannas provide the largest net carbon uptake, followed
by savannas; grasslands provide the least carbon sink. Shrublands provide a minor
carbon source.
The annual NEE estimates are not annual net biome productivity (NBP) as they
do not explicitly include the fire emissions and immediate carbon loss caused by the
removal and burning of biomass. The estimate from EC-MOD (0.54 Pg C year
-1 )
Fig. 6.5 Mean annual NEE
for the conterminous U.S.
over the period 2001–2009.
Units are g C m
-2 year
-1
.
Negative values indicate
carbon uptake, and positive
values indicate carbon
release. Gray lines indicate
state boundaries
160
J. Xiao
The 8-day NEE estimates were aggregated to the annual scale for each year from
2001 to 2009, and mean annual NEE was then calculated for the 9-year period
(Fig. 6.5). The net flux here represents the terrestrial part of the carbon cycle
without fire emissions and immediate carbon loss caused by the removal and
burning of biomass. The mean annual NEE map shows that the eastern U.S.
sequesters CO 2 from the atmosphere and thus provides a carbon sink. The coastal
Pacific Northwest, the Rocky Mountains, and a part of California also provide
carbon sinks. Many other areas in the western U.S. including the Great Basin, the
Colorado Plateau, and the western Great Plains, however, do not significantly
sequester CO 2 from the atmosphere or release carbon and are thus nearly carbon
neutral likely due to sparse vegetation and water stress. Some regions in the West,
particularly southwestern states including Nevada, Arizona, New Mexico, and
western Texas, provide minor carbon sources.
Figure 6.6 shows the mean annual NEE integrated over the U.S. and for each
broad vegetation type. On average, the total annual NEE of the U.S. terrestrial
ecosystems is -0.97 Pg C year
-1 (1 Pg = 10
15 g). The annual NEE of natural
ecosystems and croplands is -0.54 and -0.43 Pg C year
-1 , respectively. These
estimates are slightly lower than the previous EC-MOD estimates in absolute
magnitude for the period 2001–2006 (-0.63 and -0.58 Pg C year
-1 for natural
ecosystems and croplands, respectively; Xiao et al. 2011a). Among natural
ecosystems, forests and savannas provide the largest net carbon uptake, followed
by savannas; grasslands provide the least carbon sink. Shrublands provide a minor
carbon source.
The annual NEE estimates are not annual net biome productivity (NBP) as they
do not explicitly include the fire emissions and immediate carbon loss caused by the
removal and burning of biomass. The estimate from EC-MOD (0.54 Pg C year
-1 )
Fig. 6.5 Mean annual NEE
for the conterminous U.S.
over the period 2001–2009.
Units are g C m
-2 year
-1
.
Negative values indicate
carbon uptake, and positive
values indicate carbon
release. Gray lines indicate
state boundaries
160
J. Xiao