

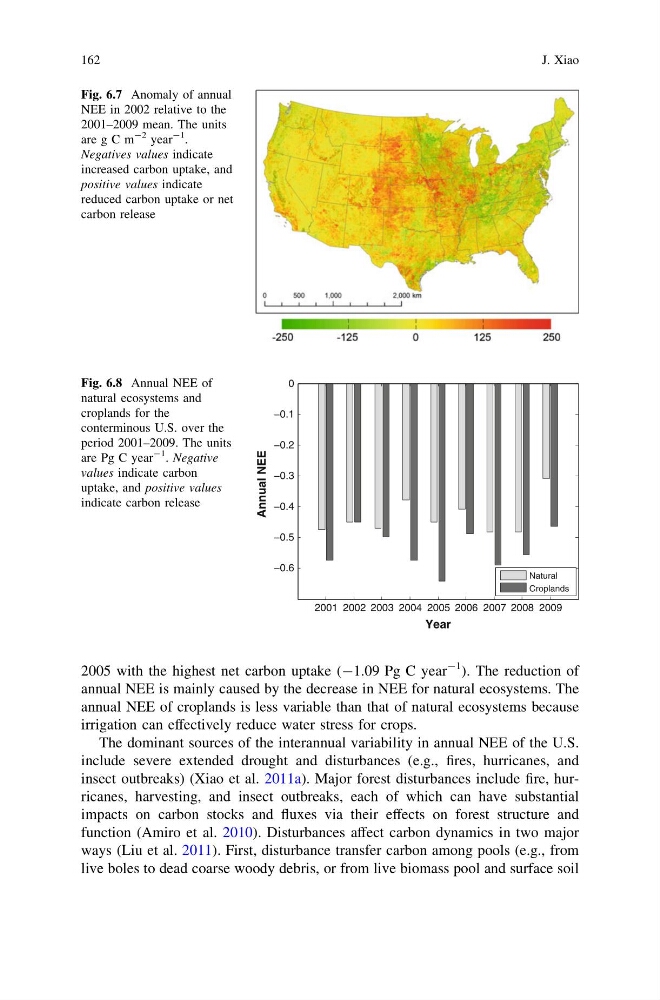
2005 with the highest net carbon uptake (-1.09 Pg C year
-1 ). The reduction of
annual NEE is mainly caused by the decrease in NEE for natural ecosystems. The
annual NEE of croplands is less variable than that of natural ecosystems because
irrigation can effectively reduce water stress for crops.
The dominant sources of the interannual variability in annual NEE of the U.S.
include severe extended drought and disturbances (e.g., fires, hurricanes, and
insect outbreaks) (Xiao et al. 2011a). Major forest disturbances include fire, hurricanes, harvesting, and insect outbreaks, each of which can have substantial
impacts on carbon stocks and fluxes via their effects on forest structure and
function (Amiro et al. 2010). Disturbances affect carbon dynamics in two major
ways (Liu et al. 2011). First, disturbance transfer carbon among pools (e.g., from
live boles to dead coarse woody debris, or from live biomass pool and surface soil
Fig. 6.7 Anomaly of annual
NEE in 2002 relative to the
2001–2009 mean. The units
are g C m
-2 year
-1
.
Negatives values indicate
increased carbon uptake, and
positive values indicate
reduced carbon uptake or net
carbon release
2001 2002 2003 2004 2005 2006 2007 2008 2009
−0.6
−0.5
−0.4
−0.3
−0.2
−0.1
0
Year
Annual NEE
Natural
Croplands
Fig. 6.8 Annual NEE of
natural ecosystems and
croplands for the
conterminous U.S. over the
period 2001–2009. The units
are Pg C year
-1
. Negative
values indicate carbon
uptake, and positive values
indicate carbon release
162
J. Xiao
-1 ). The reduction of
annual NEE is mainly caused by the decrease in NEE for natural ecosystems. The
annual NEE of croplands is less variable than that of natural ecosystems because
irrigation can effectively reduce water stress for crops.
The dominant sources of the interannual variability in annual NEE of the U.S.
include severe extended drought and disturbances (e.g., fires, hurricanes, and
insect outbreaks) (Xiao et al. 2011a). Major forest disturbances include fire, hurricanes, harvesting, and insect outbreaks, each of which can have substantial
impacts on carbon stocks and fluxes via their effects on forest structure and
function (Amiro et al. 2010). Disturbances affect carbon dynamics in two major
ways (Liu et al. 2011). First, disturbance transfer carbon among pools (e.g., from
live boles to dead coarse woody debris, or from live biomass pool and surface soil
Fig. 6.7 Anomaly of annual
NEE in 2002 relative to the
2001–2009 mean. The units
are g C m
-2 year
-1
.
Negatives values indicate
increased carbon uptake, and
positive values indicate
reduced carbon uptake or net
carbon release
2001 2002 2003 2004 2005 2006 2007 2008 2009
−0.6
−0.5
−0.4
−0.3
−0.2
−0.1
0
Year
Annual NEE
Natural
Croplands
Fig. 6.8 Annual NEE of
natural ecosystems and
croplands for the
conterminous U.S. over the
period 2001–2009. The units
are Pg C year
-1
. Negative
values indicate carbon
uptake, and positive values
indicate carbon release
162
J. Xiao