

approaches, ecosystem modeling, and atmospheric inversions. The extended
EC-MOD flux estimates are used to examine the spatial and temporal dynamics of
NEE at seasonal, annual, and interannual scales.
6.5.1 Monthly NEE and Seasonality
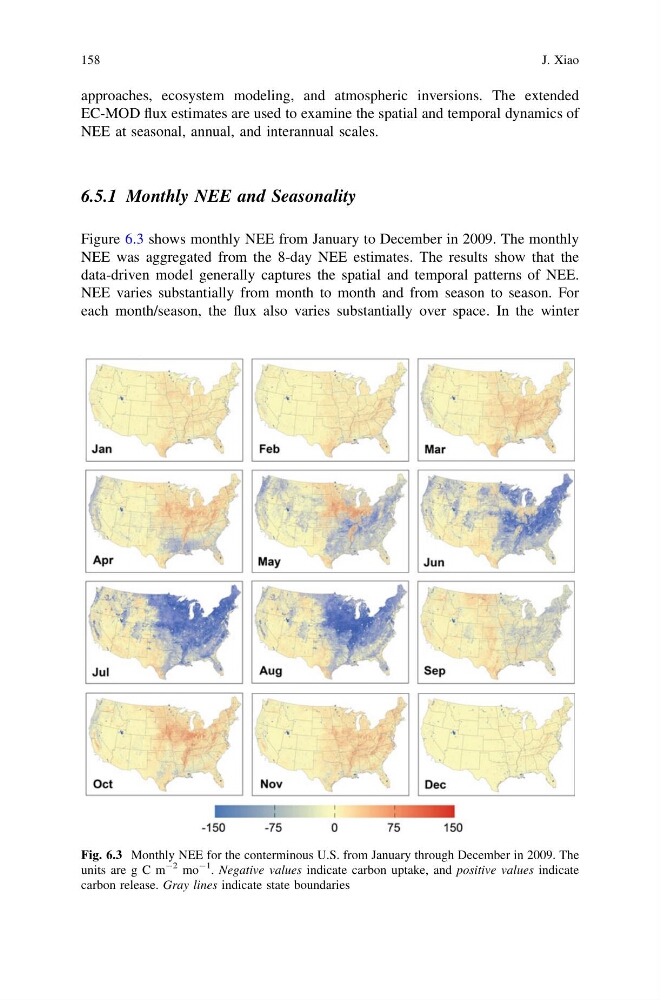
Figure 6.3 shows monthly NEE from January to December in 2009. The monthly
NEE was aggregated from the 8-day NEE estimates. The results show that the
data-driven model generally captures the spatial and temporal patterns of NEE.
NEE varies substantially from month to month and from season to season. For
each month/season, the flux also varies substantially over space. In the winter
Fig. 6.3 Monthly NEE for the conterminous U.S. from January through December in 2009. The
units are g C m
-2 mo
-1
. Negative values indicate carbon uptake, and positive values indicate
carbon release. Gray lines indicate state boundaries
158
J. Xiao
EC-MOD flux estimates are used to examine the spatial and temporal dynamics of
NEE at seasonal, annual, and interannual scales.
6.5.1 Monthly NEE and Seasonality
Figure 6.3 shows monthly NEE from January to December in 2009. The monthly
NEE was aggregated from the 8-day NEE estimates. The results show that the
data-driven model generally captures the spatial and temporal patterns of NEE.
NEE varies substantially from month to month and from season to season. For
each month/season, the flux also varies substantially over space. In the winter
Fig. 6.3 Monthly NEE for the conterminous U.S. from January through December in 2009. The
units are g C m
-2 mo
-1
. Negative values indicate carbon uptake, and positive values indicate
carbon release. Gray lines indicate state boundaries
158
J. Xiao