

6.4 Validation
Cross-validation can provide an estimate of the predictive accuracy of the
predictive model. The k-fold cross-validation, in which the cases are divided into
k blocks of roughly the same size and target value distribution, is used here. For
each block, a predictive model is constructed from the cases in the remaining
blocks, while the cases in the hold-out block is then used to test the performance of
the model (RuleQuest 2008). The cross-validation shows that the predictive
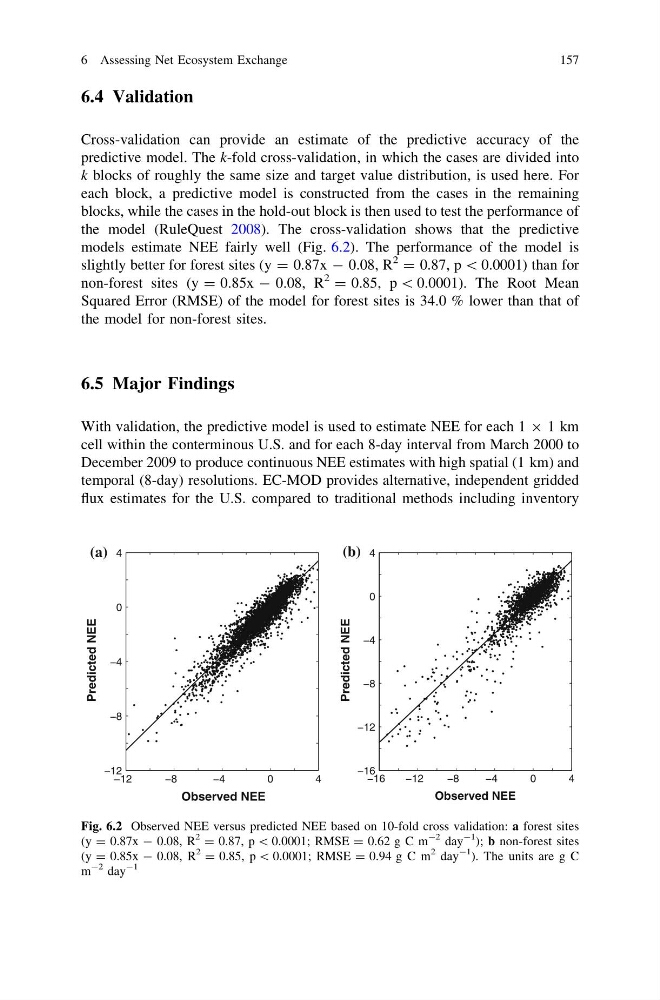
models estimate NEE fairly well (Fig. 6.2). The performance of the model is
slightly better for forest sites (y = 0.87x - 0.08, R
2 = 0.87, p \ 0.0001) than for
non-forest sites (y = 0.85x - 0.08, R
2 = 0.85, p \ 0.0001). The Root Mean
Squared Error (RMSE) of the model for forest sites is 34.0 % lower than that of
the model for non-forest sites.
6.5 Major Findings
With validation, the predictive model is used to estimate NEE for each 1 9 1 km
cell within the conterminous U.S. and for each 8-day interval from March 2000 to
December 2009 to produce continuous NEE estimates with high spatial (1 km) and
temporal (8-day) resolutions. EC-MOD provides alternative, independent gridded
flux estimates for the U.S. compared to traditional methods including inventory
−12
−8
−4
0
4
−12
−8
−4
0
4
Observed NEE
Predicted NEE
−16
−12
−8
−4
0
4
−16
−12
−8
−4
0
4
Observed NEE
Predicted NEE
(a)
(b)
Fig. 6.2 Observed NEE versus predicted NEE based on 10-fold cross validation: a forest sites
(y = 0.87x - 0.08, R
2 = 0.87, p \ 0.0001; RMSE = 0.62 g C m
-2 day
-1
); b non-forest sites
(y = 0.85x - 0.08, R
2 = 0.85, p \ 0.0001; RMSE = 0.94 g C m
2 day
-1
). The units are g C
m
-2 day
-1
6 Assessing Net Ecosystem Exchange
157
Cross-validation can provide an estimate of the predictive accuracy of the
predictive model. The k-fold cross-validation, in which the cases are divided into
k blocks of roughly the same size and target value distribution, is used here. For
each block, a predictive model is constructed from the cases in the remaining
blocks, while the cases in the hold-out block is then used to test the performance of
the model (RuleQuest 2008). The cross-validation shows that the predictive
models estimate NEE fairly well (Fig. 6.2). The performance of the model is
slightly better for forest sites (y = 0.87x - 0.08, R
2 = 0.87, p \ 0.0001) than for
non-forest sites (y = 0.85x - 0.08, R
2 = 0.85, p \ 0.0001). The Root Mean
Squared Error (RMSE) of the model for forest sites is 34.0 % lower than that of
the model for non-forest sites.
6.5 Major Findings
With validation, the predictive model is used to estimate NEE for each 1 9 1 km
cell within the conterminous U.S. and for each 8-day interval from March 2000 to
December 2009 to produce continuous NEE estimates with high spatial (1 km) and
temporal (8-day) resolutions. EC-MOD provides alternative, independent gridded
flux estimates for the U.S. compared to traditional methods including inventory
−12
−8
−4
0
4
−12
−8
−4
0
4
Observed NEE
Predicted NEE
−16
−12
−8
−4
0
4
−16
−12
−8
−4
0
4
Observed NEE
Predicted NEE
(a)
(b)
Fig. 6.2 Observed NEE versus predicted NEE based on 10-fold cross validation: a forest sites
(y = 0.87x - 0.08, R
2 = 0.87, p \ 0.0001; RMSE = 0.62 g C m
-2 day
-1
); b non-forest sites
(y = 0.85x - 0.08, R
2 = 0.85, p \ 0.0001; RMSE = 0.94 g C m
2 day
-1
). The units are g C
m
-2 day
-1
6 Assessing Net Ecosystem Exchange
157