

with m 0 ¼ cosðy
0
0 Þ; y
0
0 being the in-water refracted angle, backscattering coefficient
b b ¼ Bb, B being the backscattering probability, m 0 ¼ 0:858 for overcast conditions, (À0) indicating just beneath the water surface, a and b are respectively
coefficients of absorption and scattering within the water column.
It is known that the IOPs of an aquatic medium (in our case the coefficients of
adsorption and backscattering) are additive in nature and can be expressed as a sum
of products of absorption (a*) and backscattering (b b *) cross-sections and the
concentrations of respective CPAs – C i :
a ¼ a w þ
X
i
C i a
Ã
i ; b b ¼ ðb b Þ w þ
X
j
C j ðb b Þ
Ã
j ;
(16.4)
where subscripts w, i and j stand, respectively, for water and co-existing absorbing
and scattering water medium components, the overall number of which does not
necessarily need to be equal. Thus, given tabulated spectral values of absorption
and backscattering cross-sections for each CPA, its individual contribution to the
hydro-optical bulk properties of the target water column can be related to its
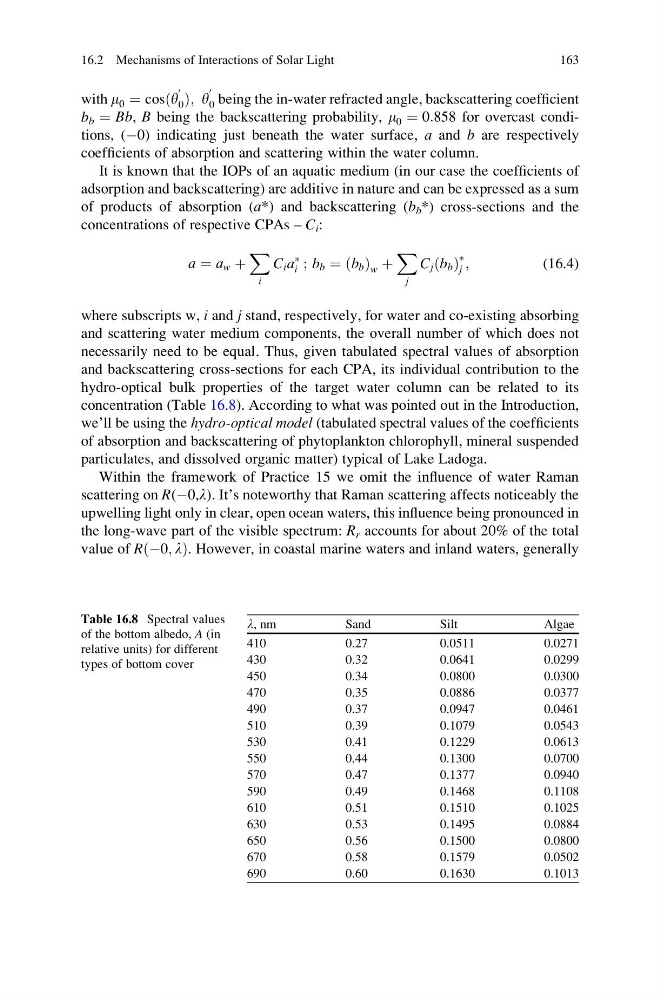
concentration (Table 16.8). According to what was pointed out in the Introduction,
we’ll be using the hydro-optical model (tabulated spectral values of the coefficients
of absorption and backscattering of phytoplankton chlorophyll, mineral suspended
particulates, and dissolved organic matter) typical of Lake Ladoga.
Within the framework of Practice 15 we omit the influence of water Raman
scattering on R(À0,l). It’s noteworthy that Raman scattering affects noticeably the
upwelling light only in clear, open ocean waters, this influence being pronounced in
the long-wave part of the visible spectrum: R r accounts for about 20% of the total
value of RðÀ0; lÞ. However, in coastal marine waters and inland waters, generally
Table 16.8 Spectral values
of the bottom albedo, A (in
relative units) for different
types of bottom cover
l, nm
Sand
Silt
Algae
410
0.27
0.0511
0.0271
430
0.32
0.0641
0.0299
450
0.34
0.0800
0.0300
470
0.35
0.0886
0.0377
490
0.37
0.0947
0.0461
510
0.39
0.1079
0.0543
530
0.41
0.1229
0.0613
550
0.44
0.1300
0.0700
570
0.47
0.1377
0.0940
590
0.49
0.1468
0.1108
610
0.51
0.1510
0.1025
630
0.53
0.1495
0.0884
650
0.56
0.1500
0.0800
670
0.58
0.1579
0.0502
690
0.60
0.1630
0.1013
16.2 Mechanisms of Interactions of Solar Light
163
0
0 Þ; y
0
0 being the in-water refracted angle, backscattering coefficient
b b ¼ Bb, B being the backscattering probability, m 0 ¼ 0:858 for overcast conditions, (À0) indicating just beneath the water surface, a and b are respectively
coefficients of absorption and scattering within the water column.
It is known that the IOPs of an aquatic medium (in our case the coefficients of
adsorption and backscattering) are additive in nature and can be expressed as a sum
of products of absorption (a*) and backscattering (b b *) cross-sections and the
concentrations of respective CPAs – C i :
a ¼ a w þ
X
i
C i a
Ã
i ; b b ¼ ðb b Þ w þ
X
j
C j ðb b Þ
Ã
j ;
(16.4)
where subscripts w, i and j stand, respectively, for water and co-existing absorbing
and scattering water medium components, the overall number of which does not
necessarily need to be equal. Thus, given tabulated spectral values of absorption
and backscattering cross-sections for each CPA, its individual contribution to the
hydro-optical bulk properties of the target water column can be related to its
concentration (Table 16.8). According to what was pointed out in the Introduction,
we’ll be using the hydro-optical model (tabulated spectral values of the coefficients
of absorption and backscattering of phytoplankton chlorophyll, mineral suspended
particulates, and dissolved organic matter) typical of Lake Ladoga.
Within the framework of Practice 15 we omit the influence of water Raman
scattering on R(À0,l). It’s noteworthy that Raman scattering affects noticeably the
upwelling light only in clear, open ocean waters, this influence being pronounced in
the long-wave part of the visible spectrum: R r accounts for about 20% of the total
value of RðÀ0; lÞ. However, in coastal marine waters and inland waters, generally
Table 16.8 Spectral values
of the bottom albedo, A (in
relative units) for different
types of bottom cover
l, nm
Sand
Silt
Algae
410
0.27
0.0511
0.0271
430
0.32
0.0641
0.0299
450
0.34
0.0800
0.0300
470
0.35
0.0886
0.0377
490
0.37
0.0947
0.0461
510
0.39
0.1079
0.0543
530
0.41
0.1229
0.0613
550
0.44
0.1300
0.0700
570
0.47
0.1377
0.0940
590
0.49
0.1468
0.1108
610
0.51
0.1510
0.1025
630
0.53
0.1495
0.0884
650
0.56
0.1500
0.0800
670
0.58
0.1579
0.0502
690
0.60
0.1630
0.1013
16.2 Mechanisms of Interactions of Solar Light
163