

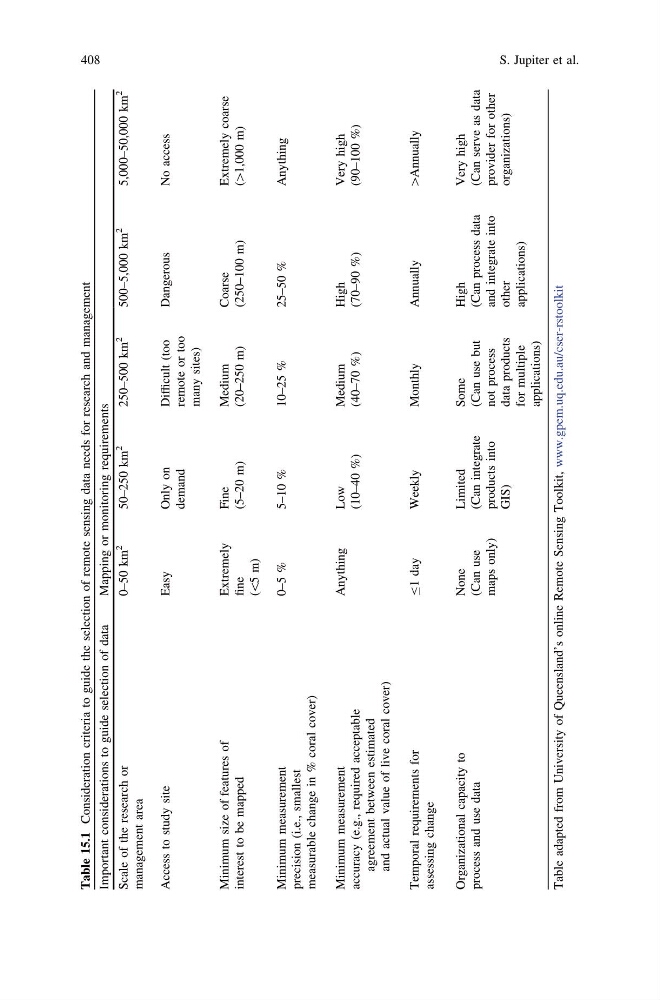
Table 15.1
Consideration criteria to guide the selection of remote sensing data needs for research and management
Important considerations to guide selection of data
Mapping or monitoring requirements
Scale of the research or
management area
0–50 km
2
50–250 km
2
250–500 km
2
500–5,000 km
2
5,000–50,000 km
2
Access to study site
Easy
Only on
demand
Difficult (too
remote or too
many sites)
Dangerous
No access
Minimum size of features of
interest to be mapped
Extremely
fine
(\5 m)
Fine
(5–20 m)
Medium
(20–250 m)
Coarse
(250–100 m)
Extremely coarse
([1,000 m)
Minimum measurement
precision (i.e., smallest
measurable change in % coral cover)
0–5 %
5–10 %
10–25 %
25–50 %
Anything
Minimum measurement
accuracy (e.g., required acceptable
agreement between estimated
and actual value of live coral cover)
Anything
Low
(10–40 %)
Medium
(40–70 %)
High
(70–90 %)
Very high
(90–100 %)
Temporal requirements for
assessing change
B1 day
Weekly
Monthly
Annually
[Annually
Organizational capacity to
process and use data
None
(Can use
maps only)
Limited
(Can integrate
products into
GIS)
Some
(Can use but
not process
data products
for multiple
applications)
High
(Can process data
and integrate into
other
applications)
Very high
(Can serve as data
provider for other
organizations)
Table adapted from University of Queensland’s online Remote Sensing Toolkit, www.gpem.uq.edu.au/cser-rstoolkit
408
S. Jupiter et al.
Consideration criteria to guide the selection of remote sensing data needs for research and management
Important considerations to guide selection of data
Mapping or monitoring requirements
Scale of the research or
management area
0–50 km
2
50–250 km
2
250–500 km
2
500–5,000 km
2
5,000–50,000 km
2
Access to study site
Easy
Only on
demand
Difficult (too
remote or too
many sites)
Dangerous
No access
Minimum size of features of
interest to be mapped
Extremely
fine
(\5 m)
Fine
(5–20 m)
Medium
(20–250 m)
Coarse
(250–100 m)
Extremely coarse
([1,000 m)
Minimum measurement
precision (i.e., smallest
measurable change in % coral cover)
0–5 %
5–10 %
10–25 %
25–50 %
Anything
Minimum measurement
accuracy (e.g., required acceptable
agreement between estimated
and actual value of live coral cover)
Anything
Low
(10–40 %)
Medium
(40–70 %)
High
(70–90 %)
Very high
(90–100 %)
Temporal requirements for
assessing change
B1 day
Weekly
Monthly
Annually
[Annually
Organizational capacity to
process and use data
None
(Can use
maps only)
Limited
(Can integrate
products into
GIS)
Some
(Can use but
not process
data products
for multiple
applications)
High
(Can process data
and integrate into
other
applications)
Very high
(Can serve as data
provider for other
organizations)
Table adapted from University of Queensland’s online Remote Sensing Toolkit, www.gpem.uq.edu.au/cser-rstoolkit
408
S. Jupiter et al.