

Heron et al. (2009) analyzed the Pathfinder data from 1985 to 2006 to determine
trends in SST of the climatologically warmest month (which is specific to each
location) to examine changes in the level of summertime thermal stress as an
indicator of coral bleaching risk. This study showed warming trends over much of
the globe, particularly in the Northern Hemisphere (Fig. 12.2a). Comparison of
trend values with their standard error (Fig. 12.2b) showed only small oceanic areas
cooling at a rate significantly different from zero, primarily in the southern ocean.
However, much of the western and northern Pacific Ocean and the northern
Atlantic Ocean experienced SST increases of more than double the standard error
of the trend.
A major source of short-term climate variation is the well-known El NiñoSouthern Oscillation (ENSO) phenomenon in which the extreme phases of El Niño
and La Niña are linked to characteristic oceanic and atmospheric conditions that
typically evolve over 12–18 months (McPhaden 2004). ENSO events do not, of
themselves, cause coral bleaching; however, they can modulate the likelihood of
bleaching occurring in different ocean basins by modifying general SST patterns.
Eakin et al. (2009) examined how SST patterns compared across 20 El Niño, 20 La
Niña and 20 ENSO-neutral events, considering average patterns in both the year of
onset and the following year. The study indicated that much of the tropical ocean
experiences significantly warmer maximum SST during El Niño events as compared with neutral years, initially in just the eastern Pacific Ocean and during the
following year also in the Indian Ocean and greater Caribbean region. It is of note
that a ‘horseshoe’ of cooler conditions ‘arcs’ from the north-central Pacific to the
western Pacific, continuing to the south-central Pacific during El Niño years.
However, this pattern reverses during the years of La Niña conditions, such that
the locations in the horseshoe experience warmer conditions while other regions
experience generally cooler conditions (compared with ENSO-neutral years).
ENSO conditions can be monitored using ocean temperature indices such as the
Niño 3.4 index, which is the average SST anomaly across the region [170–120°W,
5°S–5°N], and atmospheric indices such as the Southern Oscillation Index, which
is the atmospheric pressure difference between Tahiti, French Polynesia and
Darwin, Australia. It is of note that there has been recent evidence of anomalous
ocean warming in the central Pacific Ocean that has not followed the
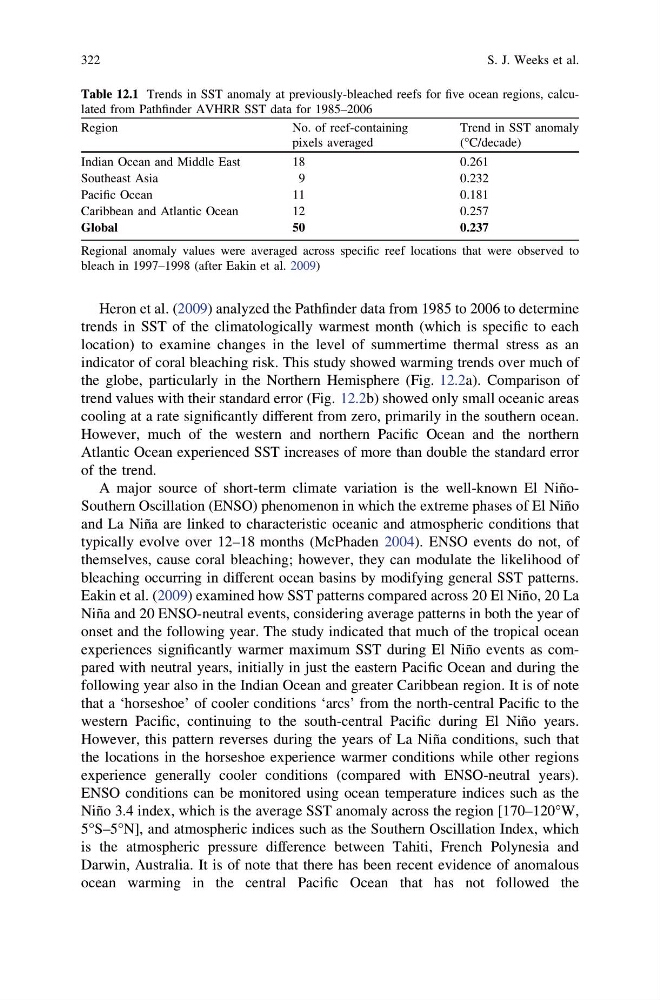
Table 12.1 Trends in SST anomaly at previously-bleached reefs for five ocean regions, calculated from Pathfinder AVHRR SST data for 1985–2006
Region
No. of reef-containing
pixels averaged
Trend in SST anomaly
(°C/decade)
Indian Ocean and Middle East
18
0.261
Southeast Asia
9
0.232
Pacific Ocean
11
0.181
Caribbean and Atlantic Ocean
12
0.257
Global
50
0.237
Regional anomaly values were averaged across specific reef locations that were observed to
bleach in 1997–1998 (after Eakin et al. 2009)
322
S. J. Weeks et al.
trends in SST of the climatologically warmest month (which is specific to each
location) to examine changes in the level of summertime thermal stress as an
indicator of coral bleaching risk. This study showed warming trends over much of
the globe, particularly in the Northern Hemisphere (Fig. 12.2a). Comparison of
trend values with their standard error (Fig. 12.2b) showed only small oceanic areas
cooling at a rate significantly different from zero, primarily in the southern ocean.
However, much of the western and northern Pacific Ocean and the northern
Atlantic Ocean experienced SST increases of more than double the standard error
of the trend.
A major source of short-term climate variation is the well-known El NiñoSouthern Oscillation (ENSO) phenomenon in which the extreme phases of El Niño
and La Niña are linked to characteristic oceanic and atmospheric conditions that
typically evolve over 12–18 months (McPhaden 2004). ENSO events do not, of
themselves, cause coral bleaching; however, they can modulate the likelihood of
bleaching occurring in different ocean basins by modifying general SST patterns.
Eakin et al. (2009) examined how SST patterns compared across 20 El Niño, 20 La
Niña and 20 ENSO-neutral events, considering average patterns in both the year of
onset and the following year. The study indicated that much of the tropical ocean
experiences significantly warmer maximum SST during El Niño events as compared with neutral years, initially in just the eastern Pacific Ocean and during the
following year also in the Indian Ocean and greater Caribbean region. It is of note
that a ‘horseshoe’ of cooler conditions ‘arcs’ from the north-central Pacific to the
western Pacific, continuing to the south-central Pacific during El Niño years.
However, this pattern reverses during the years of La Niña conditions, such that
the locations in the horseshoe experience warmer conditions while other regions
experience generally cooler conditions (compared with ENSO-neutral years).
ENSO conditions can be monitored using ocean temperature indices such as the
Niño 3.4 index, which is the average SST anomaly across the region [170–120°W,
5°S–5°N], and atmospheric indices such as the Southern Oscillation Index, which
is the atmospheric pressure difference between Tahiti, French Polynesia and
Darwin, Australia. It is of note that there has been recent evidence of anomalous
ocean warming in the central Pacific Ocean that has not followed the
Table 12.1 Trends in SST anomaly at previously-bleached reefs for five ocean regions, calculated from Pathfinder AVHRR SST data for 1985–2006
Region
No. of reef-containing
pixels averaged
Trend in SST anomaly
(°C/decade)
Indian Ocean and Middle East
18
0.261
Southeast Asia
9
0.232
Pacific Ocean
11
0.181
Caribbean and Atlantic Ocean
12
0.257
Global
50
0.237
Regional anomaly values were averaged across specific reef locations that were observed to
bleach in 1997–1998 (after Eakin et al. 2009)
322
S. J. Weeks et al.