

Below this, the bulk temperature (SST bulk ) varies with depth within the water
column. As a result, in situ temperature measurements are of bulk temperature and
should be described with the associated depth of acquisition.
Coral bleaching events have been linked to conditions of clear sunny skies and
low mixing when the ocean surface becomes stratified, enhancing near-surface
heating during the daytime (Skirving et al. 2006). The daily variation (i.e., diel
fluctuation) in temperature is typically around 0.6 K but has been reported as high
as 2.8 K (Zeng et al. 1999) and, as such, is an important consideration for satellite
monitoring of conditions on coral reefs. While there may be differences between
the absolute temperature measured by satellite and that at the depth of corals,
monitoring applications often utilize temperature anomalies to describe the level
of thermal stress experienced at specific locations (see Chap. 12). Inherent within
this approach is an assumption that the anomaly at the skin is consistent with that
experienced by the corals, which leads some monitoring efforts (e.g., Coral Reef
Watch) to use night-only data so as to avoid the issue of diel warming.
A final issue for satellite monitoring is sunglint, where under certain conditions,
particularly during periods of low wind, sunlight is reflected off the ocean surface
into the view of the sensor. Sunglint ‘‘contaminates’’ the measured satellite retrievals and results in false temperatures due to this reflected thermal radiation from
the sun. In SST analysis, areas of sunglint are identified during processing, based
Day
Night/
Mixed
SST interface
SST skin
SST subskin
SST bulk
SST bulk
Temperature
Depth
interface
10 µm
~1 mm
~1 cm
~1 m
~10 m
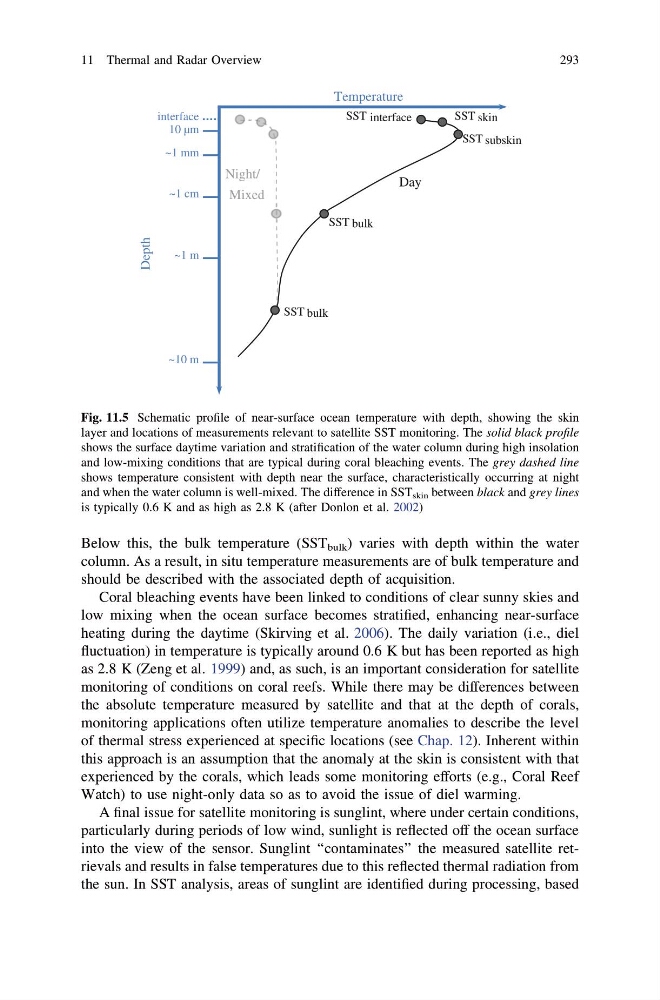
Fig. 11.5 Schematic profile of near-surface ocean temperature with depth, showing the skin
layer and locations of measurements relevant to satellite SST monitoring. The solid black profile
shows the surface daytime variation and stratification of the water column during high insolation
and low-mixing conditions that are typical during coral bleaching events. The grey dashed line
shows temperature consistent with depth near the surface, characteristically occurring at night
and when the water column is well-mixed. The difference in SST skin between black and grey lines
is typically 0.6 K and as high as 2.8 K (after Donlon et al. 2002)
11 Thermal and Radar Overview
293
column. As a result, in situ temperature measurements are of bulk temperature and
should be described with the associated depth of acquisition.
Coral bleaching events have been linked to conditions of clear sunny skies and
low mixing when the ocean surface becomes stratified, enhancing near-surface
heating during the daytime (Skirving et al. 2006). The daily variation (i.e., diel
fluctuation) in temperature is typically around 0.6 K but has been reported as high
as 2.8 K (Zeng et al. 1999) and, as such, is an important consideration for satellite
monitoring of conditions on coral reefs. While there may be differences between
the absolute temperature measured by satellite and that at the depth of corals,
monitoring applications often utilize temperature anomalies to describe the level
of thermal stress experienced at specific locations (see Chap. 12). Inherent within
this approach is an assumption that the anomaly at the skin is consistent with that
experienced by the corals, which leads some monitoring efforts (e.g., Coral Reef
Watch) to use night-only data so as to avoid the issue of diel warming.
A final issue for satellite monitoring is sunglint, where under certain conditions,
particularly during periods of low wind, sunlight is reflected off the ocean surface
into the view of the sensor. Sunglint ‘‘contaminates’’ the measured satellite retrievals and results in false temperatures due to this reflected thermal radiation from
the sun. In SST analysis, areas of sunglint are identified during processing, based
Day
Night/
Mixed
SST interface
SST skin
SST subskin
SST bulk
SST bulk
Temperature
Depth
interface
10 µm
~1 mm
~1 cm
~1 m
~10 m
Fig. 11.5 Schematic profile of near-surface ocean temperature with depth, showing the skin
layer and locations of measurements relevant to satellite SST monitoring. The solid black profile
shows the surface daytime variation and stratification of the water column during high insolation
and low-mixing conditions that are typical during coral bleaching events. The grey dashed line
shows temperature consistent with depth near the surface, characteristically occurring at night
and when the water column is well-mixed. The difference in SST skin between black and grey lines
is typically 0.6 K and as high as 2.8 K (after Donlon et al. 2002)
11 Thermal and Radar Overview
293