

Most of the live and dead coral colonies are E. profunda and L. pertusa
(Fig. 10.1b). The coral thickets are mainly located on the ridge crests, whereas the
flanks are dominated by coral rubble that gradually dissipates into the troughs.
Based on coral cover and particle grain size, six habitat classes were discriminated
along the submersible transect: (1) live dense coral thickets (25–100 % of the
seafloor covered by live and dead coral colonies in growth position); (2) dead
dense coral thickets (25–100 % of the seafloor covered by dead coral colonies
only); (3) isolated coral thickets (\25 % of the seafloor covered by dead coral
colonies in growth position); (4) coral rubble (debris on sediment bottom); (5) soft
mud-sized sediment (devoid of coral); and (6) coarse bioclastic sand (mostly
pteropods and planktonic foraminifera). Habitat classes were assigned different
color codes, and for every class, a dot of the appropriate color was plotted onto the
SSS image, with a polygon then centered on each dot for every class (Fig. 10.12).
From these polygons, the acoustic signature for each habitat class was extracted
using ENVI image analysis software (Exelis Visual Information Solutions).
Based on this process, it was determined that five habitat classes could be
distinguished acoustically. The ‘live’ and ‘dead’ dense coral thicket classes could
not be acoustically differentiated from one another and were thus combined into a
single ‘dense coral thickets’ class. The acoustic values of the five habitat classes
were further used to classify the entire SSS image using a supervised classification
algorithm (ENVI; Mahalanobis distance classifier). This classification approach
segments the SSS image according to a pixel-by-pixel classification, whereby each
classified pixel represents a small homogeneous area characterized by unique
acoustic properties that are distinguishable from other classes. To convert this
pixel classification into a vector-based classification (i.e., polygons), a 3 9 3 pixel
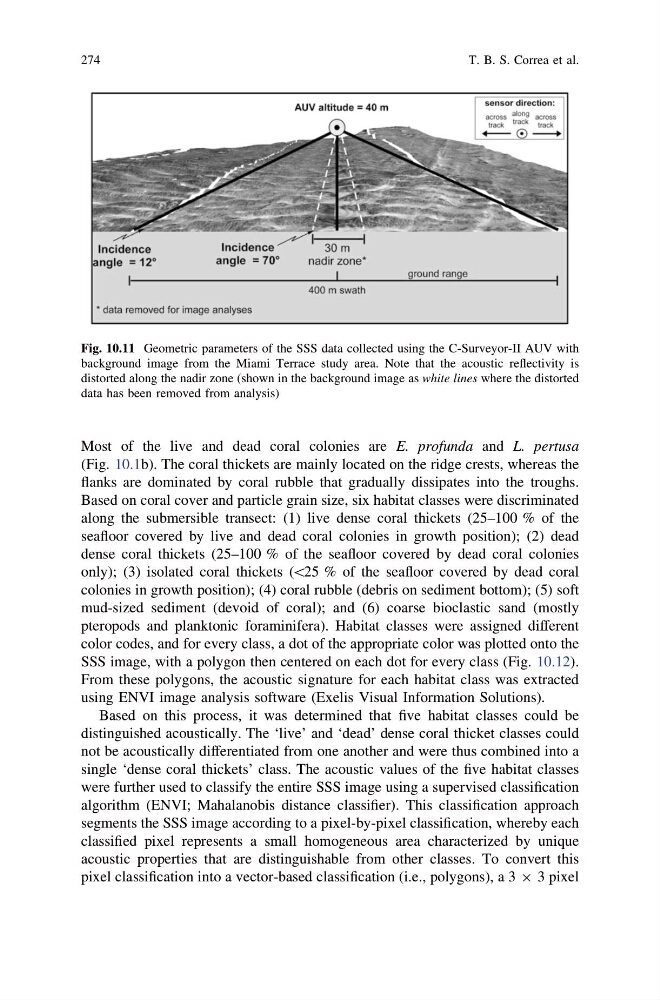
Fig. 10.11 Geometric parameters of the SSS data collected using the C-Surveyor-II AUV with
background image from the Miami Terrace study area. Note that the acoustic reflectivity is
distorted along the nadir zone (shown in the background image as white lines where the distorted
data has been removed from analysis)
274
T. B. S. Correa et al.
(Fig. 10.1b). The coral thickets are mainly located on the ridge crests, whereas the
flanks are dominated by coral rubble that gradually dissipates into the troughs.
Based on coral cover and particle grain size, six habitat classes were discriminated
along the submersible transect: (1) live dense coral thickets (25–100 % of the
seafloor covered by live and dead coral colonies in growth position); (2) dead
dense coral thickets (25–100 % of the seafloor covered by dead coral colonies
only); (3) isolated coral thickets (\25 % of the seafloor covered by dead coral
colonies in growth position); (4) coral rubble (debris on sediment bottom); (5) soft
mud-sized sediment (devoid of coral); and (6) coarse bioclastic sand (mostly
pteropods and planktonic foraminifera). Habitat classes were assigned different
color codes, and for every class, a dot of the appropriate color was plotted onto the
SSS image, with a polygon then centered on each dot for every class (Fig. 10.12).
From these polygons, the acoustic signature for each habitat class was extracted
using ENVI image analysis software (Exelis Visual Information Solutions).
Based on this process, it was determined that five habitat classes could be
distinguished acoustically. The ‘live’ and ‘dead’ dense coral thicket classes could
not be acoustically differentiated from one another and were thus combined into a
single ‘dense coral thickets’ class. The acoustic values of the five habitat classes
were further used to classify the entire SSS image using a supervised classification
algorithm (ENVI; Mahalanobis distance classifier). This classification approach
segments the SSS image according to a pixel-by-pixel classification, whereby each
classified pixel represents a small homogeneous area characterized by unique
acoustic properties that are distinguishable from other classes. To convert this
pixel classification into a vector-based classification (i.e., polygons), a 3 9 3 pixel
Fig. 10.11 Geometric parameters of the SSS data collected using the C-Surveyor-II AUV with
background image from the Miami Terrace study area. Note that the acoustic reflectivity is
distorted along the nadir zone (shown in the background image as white lines where the distorted
data has been removed from analysis)
274
T. B. S. Correa et al.