

a slightly asymmetric profile, with their steeper sides facing north (Fig. 10.9c).
These fine-scale ridges, however, can only be detected in the 3 m resolution AUV
map (Fig. 10.9). In the 50 m resolution reconnaissance map, ridges are resolved as
three large mound features up to 1.5 km
2 in footprint area (Fig. 10.9a). The
contrasting results from these two maps indicate that other areas previously surveyed solely with coarse-resolution, hull-mounted multi-beam systems might also
contain cold-water coral ridges, which have previously been interpreted as individual mounds.
The coral ridges terminate abruptly against an eastward field of sediment dunes
that are up to 5 m high. These dunes have their steeper sides facing south, in
opposite direction to the ridges’ profiles (Fig. 10.9c). Where the ridges meet the
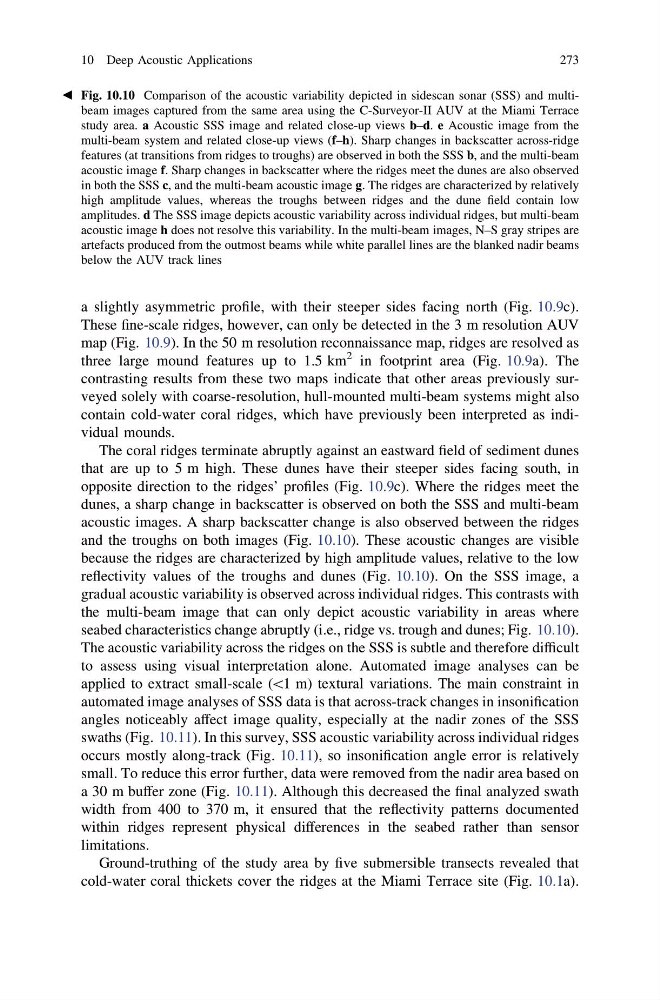
dunes, a sharp change in backscatter is observed on both the SSS and multi-beam
acoustic images. A sharp backscatter change is also observed between the ridges
and the troughs on both images (Fig. 10.10). These acoustic changes are visible
because the ridges are characterized by high amplitude values, relative to the low
reflectivity values of the troughs and dunes (Fig. 10.10). On the SSS image, a
gradual acoustic variability is observed across individual ridges. This contrasts with
the multi-beam image that can only depict acoustic variability in areas where
seabed characteristics change abruptly (i.e., ridge vs. trough and dunes; Fig. 10.10).
The acoustic variability across the ridges on the SSS is subtle and therefore difficult
to assess using visual interpretation alone. Automated image analyses can be
applied to extract small-scale (\1 m) textural variations. The main constraint in
automated image analyses of SSS data is that across-track changes in insonification
angles noticeably affect image quality, especially at the nadir zones of the SSS
swaths (Fig. 10.11). In this survey, SSS acoustic variability across individual ridges
occurs mostly along-track (Fig. 10.11), so insonification angle error is relatively
small. To reduce this error further, data were removed from the nadir area based on
a 30 m buffer zone (Fig. 10.11). Although this decreased the final analyzed swath
width from 400 to 370 m, it ensured that the reflectivity patterns documented
within ridges represent physical differences in the seabed rather than sensor
limitations.
Ground-truthing of the study area by five submersible transects revealed that
cold-water coral thickets cover the ridges at the Miami Terrace site (Fig. 10.1a).
b Fig. 10.10 Comparison of the acoustic variability depicted in sidescan sonar (SSS) and multibeam images captured from the same area using the C-Surveyor-II AUV at the Miami Terrace
study area. a Acoustic SSS image and related close-up views b–d. e Acoustic image from the
multi-beam system and related close-up views (f–h). Sharp changes in backscatter across-ridge
features (at transitions from ridges to troughs) are observed in both the SSS b, and the multi-beam
acoustic image f. Sharp changes in backscatter where the ridges meet the dunes are also observed
in both the SSS c, and the multi-beam acoustic image g. The ridges are characterized by relatively
high amplitude values, whereas the troughs between ridges and the dune field contain low
amplitudes. d The SSS image depicts acoustic variability across individual ridges, but multi-beam
acoustic image h does not resolve this variability. In the multi-beam images, N–S gray stripes are
artefacts produced from the outmost beams while white parallel lines are the blanked nadir beams
below the AUV track lines
10 Deep Acoustic Applications
273
These fine-scale ridges, however, can only be detected in the 3 m resolution AUV
map (Fig. 10.9). In the 50 m resolution reconnaissance map, ridges are resolved as
three large mound features up to 1.5 km
2 in footprint area (Fig. 10.9a). The
contrasting results from these two maps indicate that other areas previously surveyed solely with coarse-resolution, hull-mounted multi-beam systems might also
contain cold-water coral ridges, which have previously been interpreted as individual mounds.
The coral ridges terminate abruptly against an eastward field of sediment dunes
that are up to 5 m high. These dunes have their steeper sides facing south, in
opposite direction to the ridges’ profiles (Fig. 10.9c). Where the ridges meet the
dunes, a sharp change in backscatter is observed on both the SSS and multi-beam
acoustic images. A sharp backscatter change is also observed between the ridges
and the troughs on both images (Fig. 10.10). These acoustic changes are visible
because the ridges are characterized by high amplitude values, relative to the low
reflectivity values of the troughs and dunes (Fig. 10.10). On the SSS image, a
gradual acoustic variability is observed across individual ridges. This contrasts with
the multi-beam image that can only depict acoustic variability in areas where
seabed characteristics change abruptly (i.e., ridge vs. trough and dunes; Fig. 10.10).
The acoustic variability across the ridges on the SSS is subtle and therefore difficult
to assess using visual interpretation alone. Automated image analyses can be
applied to extract small-scale (\1 m) textural variations. The main constraint in
automated image analyses of SSS data is that across-track changes in insonification
angles noticeably affect image quality, especially at the nadir zones of the SSS
swaths (Fig. 10.11). In this survey, SSS acoustic variability across individual ridges
occurs mostly along-track (Fig. 10.11), so insonification angle error is relatively
small. To reduce this error further, data were removed from the nadir area based on
a 30 m buffer zone (Fig. 10.11). Although this decreased the final analyzed swath
width from 400 to 370 m, it ensured that the reflectivity patterns documented
within ridges represent physical differences in the seabed rather than sensor
limitations.
Ground-truthing of the study area by five submersible transects revealed that
cold-water coral thickets cover the ridges at the Miami Terrace site (Fig. 10.1a).
b Fig. 10.10 Comparison of the acoustic variability depicted in sidescan sonar (SSS) and multibeam images captured from the same area using the C-Surveyor-II AUV at the Miami Terrace
study area. a Acoustic SSS image and related close-up views b–d. e Acoustic image from the
multi-beam system and related close-up views (f–h). Sharp changes in backscatter across-ridge
features (at transitions from ridges to troughs) are observed in both the SSS b, and the multi-beam
acoustic image f. Sharp changes in backscatter where the ridges meet the dunes are also observed
in both the SSS c, and the multi-beam acoustic image g. The ridges are characterized by relatively
high amplitude values, whereas the troughs between ridges and the dune field contain low
amplitudes. d The SSS image depicts acoustic variability across individual ridges, but multi-beam
acoustic image h does not resolve this variability. In the multi-beam images, N–S gray stripes are
artefacts produced from the outmost beams while white parallel lines are the blanked nadir beams
below the AUV track lines
10 Deep Acoustic Applications
273