

The DEMs from the three analyzed multi-beam datasets show overall similar
mound size-frequency distributions for the GBB site (Figs. 10.4 and 10.6). The
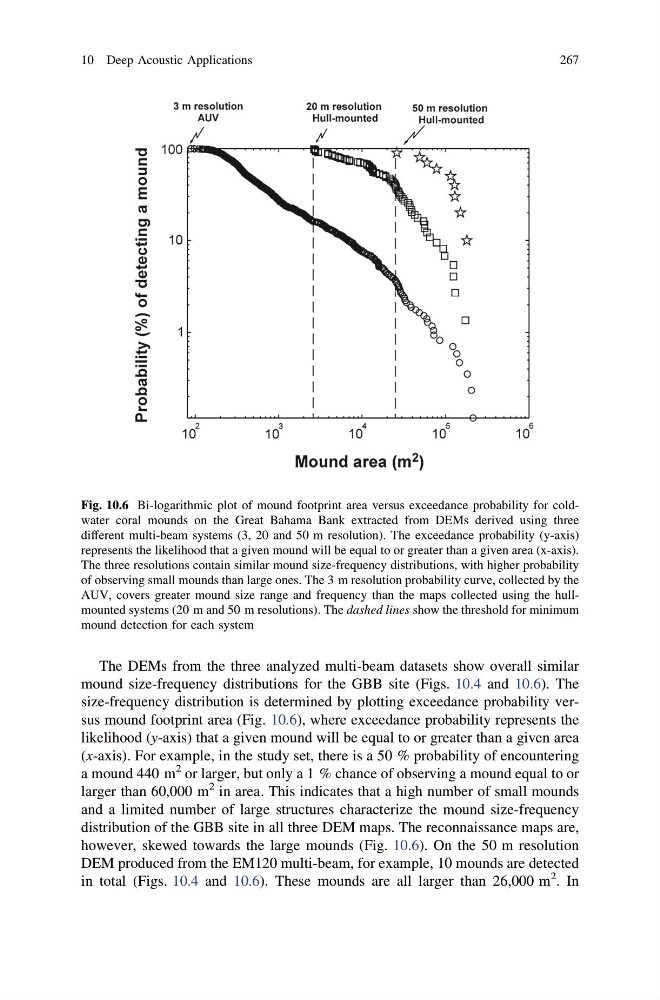
size-frequency distribution is determined by plotting exceedance probability versus mound footprint area (Fig. 10.6), where exceedance probability represents the
likelihood (y-axis) that a given mound will be equal to or greater than a given area
(x-axis). For example, in the study set, there is a 50 % probability of encountering
a mound 440 m
2 or larger, but only a 1 % chance of observing a mound equal to or
larger than 60,000 m
2 in area. This indicates that a high number of small mounds
and a limited number of large structures characterize the mound size-frequency
distribution of the GBB site in all three DEM maps. The reconnaissance maps are,
however, skewed towards the large mounds (Fig. 10.6). On the 50 m resolution
DEM produced from the EM120 multi-beam, for example, 10 mounds are detected
in total (Figs. 10.4 and 10.6). These mounds are all larger than 26,000 m
2 . In
Fig. 10.6 Bi-logarithmic plot of mound footprint area versus exceedance probability for coldwater coral mounds on the Great Bahama Bank extracted from DEMs derived using three
different multi-beam systems (3, 20 and 50 m resolution). The exceedance probability (y-axis)
represents the likelihood that a given mound will be equal to or greater than a given area (x-axis).
The three resolutions contain similar mound size-frequency distributions, with higher probability
of observing small mounds than large ones. The 3 m resolution probability curve, collected by the
AUV, covers greater mound size range and frequency than the maps collected using the hullmounted systems (20 m and 50 m resolutions). The dashed lines show the threshold for minimum
mound detection for each system
10 Deep Acoustic Applications
267
mound size-frequency distributions for the GBB site (Figs. 10.4 and 10.6). The
size-frequency distribution is determined by plotting exceedance probability versus mound footprint area (Fig. 10.6), where exceedance probability represents the
likelihood (y-axis) that a given mound will be equal to or greater than a given area
(x-axis). For example, in the study set, there is a 50 % probability of encountering
a mound 440 m
2 or larger, but only a 1 % chance of observing a mound equal to or
larger than 60,000 m
2 in area. This indicates that a high number of small mounds
and a limited number of large structures characterize the mound size-frequency
distribution of the GBB site in all three DEM maps. The reconnaissance maps are,
however, skewed towards the large mounds (Fig. 10.6). On the 50 m resolution
DEM produced from the EM120 multi-beam, for example, 10 mounds are detected
in total (Figs. 10.4 and 10.6). These mounds are all larger than 26,000 m
2 . In
Fig. 10.6 Bi-logarithmic plot of mound footprint area versus exceedance probability for coldwater coral mounds on the Great Bahama Bank extracted from DEMs derived using three
different multi-beam systems (3, 20 and 50 m resolution). The exceedance probability (y-axis)
represents the likelihood that a given mound will be equal to or greater than a given area (x-axis).
The three resolutions contain similar mound size-frequency distributions, with higher probability
of observing small mounds than large ones. The 3 m resolution probability curve, collected by the
AUV, covers greater mound size range and frequency than the maps collected using the hullmounted systems (20 m and 50 m resolutions). The dashed lines show the threshold for minimum
mound detection for each system
10 Deep Acoustic Applications
267