

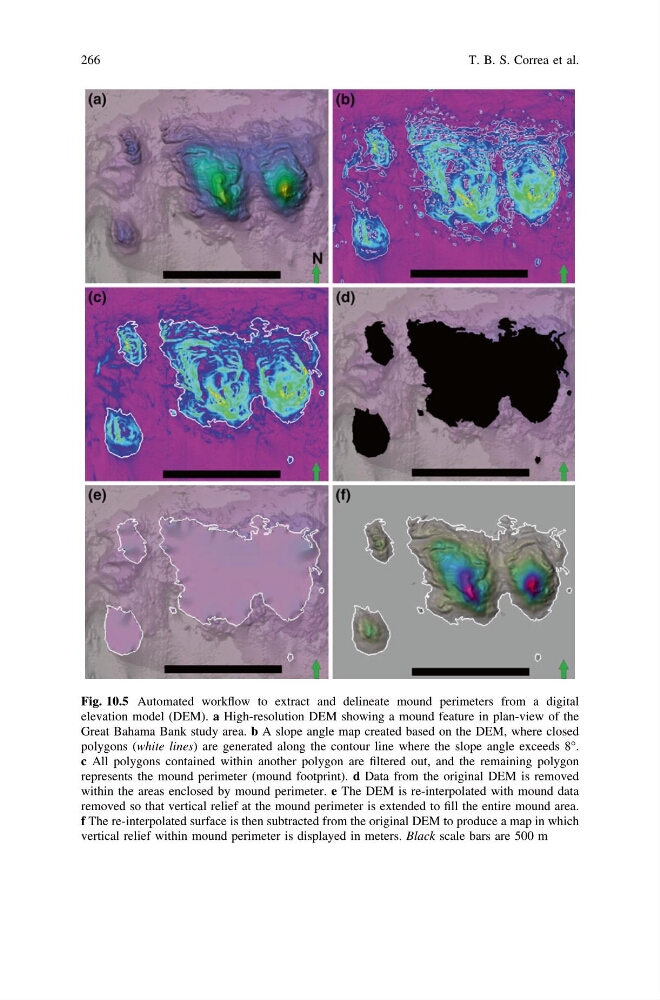
Fig. 10.5 Automated workflow to extract and delineate mound perimeters from a digital
elevation model (DEM). a High-resolution DEM showing a mound feature in plan-view of the
Great Bahama Bank study area. b A slope angle map created based on the DEM, where closed
polygons (white lines) are generated along the contour line where the slope angle exceeds 8°.
c All polygons contained within another polygon are filtered out, and the remaining polygon
represents the mound perimeter (mound footprint). d Data from the original DEM is removed
within the areas enclosed by mound perimeter. e The DEM is re-interpolated with mound data
removed so that vertical relief at the mound perimeter is extended to fill the entire mound area.
f The re-interpolated surface is then subtracted from the original DEM to produce a map in which
vertical relief within mound perimeter is displayed in meters. Black scale bars are 500 m
266
T. B. S. Correa et al.
elevation model (DEM). a High-resolution DEM showing a mound feature in plan-view of the
Great Bahama Bank study area. b A slope angle map created based on the DEM, where closed
polygons (white lines) are generated along the contour line where the slope angle exceeds 8°.
c All polygons contained within another polygon are filtered out, and the remaining polygon
represents the mound perimeter (mound footprint). d Data from the original DEM is removed
within the areas enclosed by mound perimeter. e The DEM is re-interpolated with mound data
removed so that vertical relief at the mound perimeter is extended to fill the entire mound area.
f The re-interpolated surface is then subtracted from the original DEM to produce a map in which
vertical relief within mound perimeter is displayed in meters. Black scale bars are 500 m
266
T. B. S. Correa et al.