

contrast, on the 20 m resolution DEM derived from the EM120, only mounds
larger than 2,600 m
2 could be detected (Fig. 10.6). As an additional comparison,
on the EM120 survey the GBB site contains a total of just 74 mounds (Fig. 10.6).
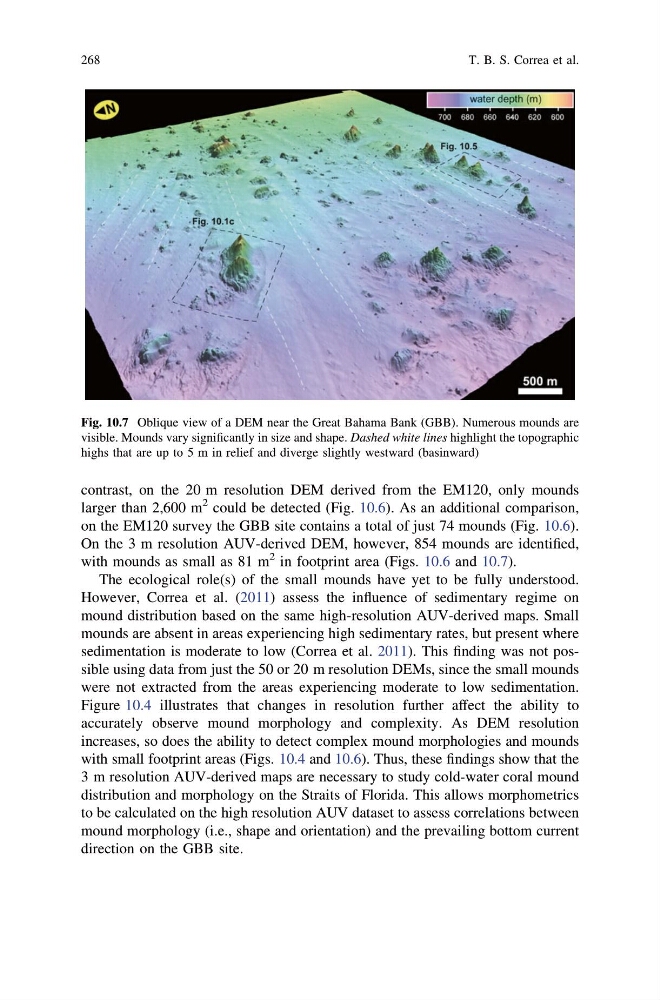
On the 3 m resolution AUV-derived DEM, however, 854 mounds are identified,
with mounds as small as 81 m
2 in footprint area (Figs. 10.6 and 10.7).
The ecological role(s) of the small mounds have yet to be fully understood.
However, Correa et al. (2011) assess the influence of sedimentary regime on
mound distribution based on the same high-resolution AUV-derived maps. Small
mounds are absent in areas experiencing high sedimentary rates, but present where
sedimentation is moderate to low (Correa et al. 2011). This finding was not possible using data from just the 50 or 20 m resolution DEMs, since the small mounds
were not extracted from the areas experiencing moderate to low sedimentation.
Figure 10.4 illustrates that changes in resolution further affect the ability to
accurately observe mound morphology and complexity. As DEM resolution
increases, so does the ability to detect complex mound morphologies and mounds
with small footprint areas (Figs. 10.4 and 10.6). Thus, these findings show that the
3 m resolution AUV-derived maps are necessary to study cold-water coral mound
distribution and morphology on the Straits of Florida. This allows morphometrics
to be calculated on the high resolution AUV dataset to assess correlations between
mound morphology (i.e., shape and orientation) and the prevailing bottom current
direction on the GBB site.
Fig. 10.7 Oblique view of a DEM near the Great Bahama Bank (GBB). Numerous mounds are
visible. Mounds vary significantly in size and shape. Dashed white lines highlight the topographic
highs that are up to 5 m in relief and diverge slightly westward (basinward)
268
T. B. S. Correa et al.
larger than 2,600 m
2 could be detected (Fig. 10.6). As an additional comparison,
on the EM120 survey the GBB site contains a total of just 74 mounds (Fig. 10.6).
On the 3 m resolution AUV-derived DEM, however, 854 mounds are identified,
with mounds as small as 81 m
2 in footprint area (Figs. 10.6 and 10.7).
The ecological role(s) of the small mounds have yet to be fully understood.
However, Correa et al. (2011) assess the influence of sedimentary regime on
mound distribution based on the same high-resolution AUV-derived maps. Small
mounds are absent in areas experiencing high sedimentary rates, but present where
sedimentation is moderate to low (Correa et al. 2011). This finding was not possible using data from just the 50 or 20 m resolution DEMs, since the small mounds
were not extracted from the areas experiencing moderate to low sedimentation.
Figure 10.4 illustrates that changes in resolution further affect the ability to
accurately observe mound morphology and complexity. As DEM resolution
increases, so does the ability to detect complex mound morphologies and mounds
with small footprint areas (Figs. 10.4 and 10.6). Thus, these findings show that the
3 m resolution AUV-derived maps are necessary to study cold-water coral mound
distribution and morphology on the Straits of Florida. This allows morphometrics
to be calculated on the high resolution AUV dataset to assess correlations between
mound morphology (i.e., shape and orientation) and the prevailing bottom current
direction on the GBB site.
Fig. 10.7 Oblique view of a DEM near the Great Bahama Bank (GBB). Numerous mounds are
visible. Mounds vary significantly in size and shape. Dashed white lines highlight the topographic
highs that are up to 5 m in relief and diverge slightly westward (basinward)
268
T. B. S. Correa et al.