

(leading edge of the first echo), E1 (trailing edge of first echo), E2 (complete
second echo), FD (fractal dimension of 1st echo), and depth. The raw sonar
datasets were empirically normalized to depth using sand as a calibration standard.
Approximately 10 % of the raw data were removed by a series of filters designed
to detect aberrant waveforms, particularly those not obtained at near vertical
incidence (e.g., those obtained during excessive pitch/roll of the survey vessel).
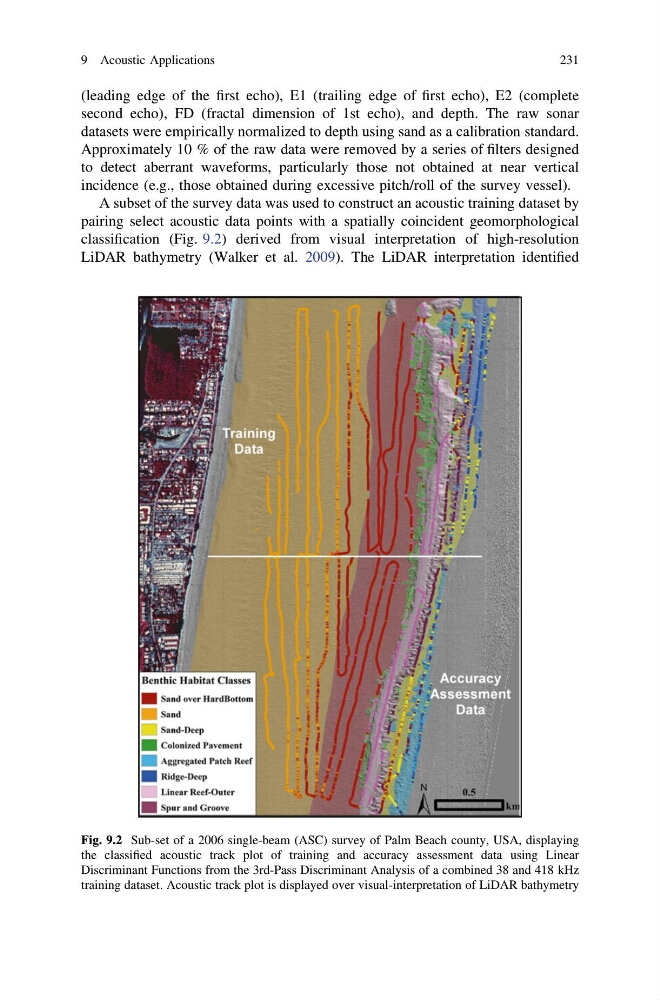
A subset of the survey data was used to construct an acoustic training dataset by
pairing select acoustic data points with a spatially coincident geomorphological
classification (Fig. 9.2) derived from visual interpretation of high-resolution
LiDAR bathymetry (Walker et al. 2009). The LiDAR interpretation identified
Fig. 9.2 Sub-set of a 2006 single-beam (ASC) survey of Palm Beach county, USA, displaying
the classified acoustic track plot of training and accuracy assessment data using Linear
Discriminant Functions from the 3rd-Pass Discriminant Analysis of a combined 38 and 418 kHz
training dataset. Acoustic track plot is displayed over visual-interpretation of LiDAR bathymetry
9 Acoustic Applications
231
second echo), FD (fractal dimension of 1st echo), and depth. The raw sonar
datasets were empirically normalized to depth using sand as a calibration standard.
Approximately 10 % of the raw data were removed by a series of filters designed
to detect aberrant waveforms, particularly those not obtained at near vertical
incidence (e.g., those obtained during excessive pitch/roll of the survey vessel).
A subset of the survey data was used to construct an acoustic training dataset by
pairing select acoustic data points with a spatially coincident geomorphological
classification (Fig. 9.2) derived from visual interpretation of high-resolution
LiDAR bathymetry (Walker et al. 2009). The LiDAR interpretation identified
Fig. 9.2 Sub-set of a 2006 single-beam (ASC) survey of Palm Beach county, USA, displaying
the classified acoustic track plot of training and accuracy assessment data using Linear
Discriminant Functions from the 3rd-Pass Discriminant Analysis of a combined 38 and 418 kHz
training dataset. Acoustic track plot is displayed over visual-interpretation of LiDAR bathymetry
9 Acoustic Applications
231