

seven benthic classes in this survey area: sand, sand-deep, colonized pavement,
ridge-deep, aggregated patch reef, linear reef-outer, and spur and groove. The
38 kHz signal revealed an eighth class, a thin (5–10 cm) veneer of sand over
hardbottom. The merged 38 and 418 kHz training dataset was then clustered into
the eight classes by supervised classification, using a series of three discriminant
analyses (DA). Eleven predictor variables were used, consisting of the 418 kHz
depth and the 38 and 418 kHz E0, E1
0 , E1, E2, and FD acoustic parameters.
Only those records that (1) were correctly classed by the discriminant analysis
and (2) exceeded a minimum probability of group membership were passed onto
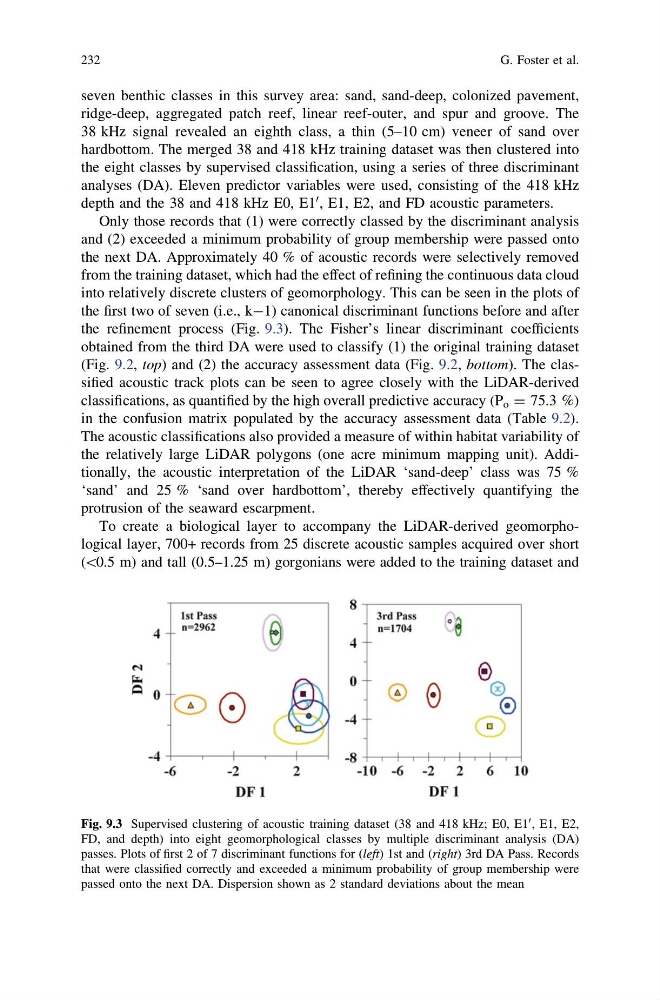
the next DA. Approximately 40 % of acoustic records were selectively removed
from the training dataset, which had the effect of refining the continuous data cloud
into relatively discrete clusters of geomorphology. This can be seen in the plots of
the first two of seven (i.e., k-1) canonical discriminant functions before and after
the refinement process (Fig. 9.3). The Fisher’s linear discriminant coefficients
obtained from the third DA were used to classify (1) the original training dataset
(Fig. 9.2, top) and (2) the accuracy assessment data (Fig. 9.2, bottom). The classified acoustic track plots can be seen to agree closely with the LiDAR-derived
classifications, as quantified by the high overall predictive accuracy (P o = 75.3 %)
in the confusion matrix populated by the accuracy assessment data (Table 9.2).
The acoustic classifications also provided a measure of within habitat variability of
the relatively large LiDAR polygons (one acre minimum mapping unit). Additionally, the acoustic interpretation of the LiDAR ‘sand-deep’ class was 75 %
‘sand’ and 25 % ‘sand over hardbottom’, thereby effectively quantifying the
protrusion of the seaward escarpment.
To create a biological layer to accompany the LiDAR-derived geomorphological layer, 700+ records from 25 discrete acoustic samples acquired over short
(\0.5 m) and tall (0.5–1.25 m) gorgonians were added to the training dataset and
Fig. 9.3 Supervised clustering of acoustic training dataset (38 and 418 kHz; E0, E1
0 , E1, E2,
FD, and depth) into eight geomorphological classes by multiple discriminant analysis (DA)
passes. Plots of first 2 of 7 discriminant functions for (left) 1st and (right) 3rd DA Pass. Records
that were classified correctly and exceeded a minimum probability of group membership were
passed onto the next DA. Dispersion shown as 2 standard deviations about the mean
232
G. Foster et al.
ridge-deep, aggregated patch reef, linear reef-outer, and spur and groove. The
38 kHz signal revealed an eighth class, a thin (5–10 cm) veneer of sand over
hardbottom. The merged 38 and 418 kHz training dataset was then clustered into
the eight classes by supervised classification, using a series of three discriminant
analyses (DA). Eleven predictor variables were used, consisting of the 418 kHz
depth and the 38 and 418 kHz E0, E1
0 , E1, E2, and FD acoustic parameters.
Only those records that (1) were correctly classed by the discriminant analysis
and (2) exceeded a minimum probability of group membership were passed onto
the next DA. Approximately 40 % of acoustic records were selectively removed
from the training dataset, which had the effect of refining the continuous data cloud
into relatively discrete clusters of geomorphology. This can be seen in the plots of
the first two of seven (i.e., k-1) canonical discriminant functions before and after
the refinement process (Fig. 9.3). The Fisher’s linear discriminant coefficients
obtained from the third DA were used to classify (1) the original training dataset
(Fig. 9.2, top) and (2) the accuracy assessment data (Fig. 9.2, bottom). The classified acoustic track plots can be seen to agree closely with the LiDAR-derived
classifications, as quantified by the high overall predictive accuracy (P o = 75.3 %)
in the confusion matrix populated by the accuracy assessment data (Table 9.2).
The acoustic classifications also provided a measure of within habitat variability of
the relatively large LiDAR polygons (one acre minimum mapping unit). Additionally, the acoustic interpretation of the LiDAR ‘sand-deep’ class was 75 %
‘sand’ and 25 % ‘sand over hardbottom’, thereby effectively quantifying the
protrusion of the seaward escarpment.
To create a biological layer to accompany the LiDAR-derived geomorphological layer, 700+ records from 25 discrete acoustic samples acquired over short
(\0.5 m) and tall (0.5–1.25 m) gorgonians were added to the training dataset and
Fig. 9.3 Supervised clustering of acoustic training dataset (38 and 418 kHz; E0, E1
0 , E1, E2,
FD, and depth) into eight geomorphological classes by multiple discriminant analysis (DA)
passes. Plots of first 2 of 7 discriminant functions for (left) 1st and (right) 3rd DA Pass. Records
that were classified correctly and exceeded a minimum probability of group membership were
passed onto the next DA. Dispersion shown as 2 standard deviations about the mean
232
G. Foster et al.