

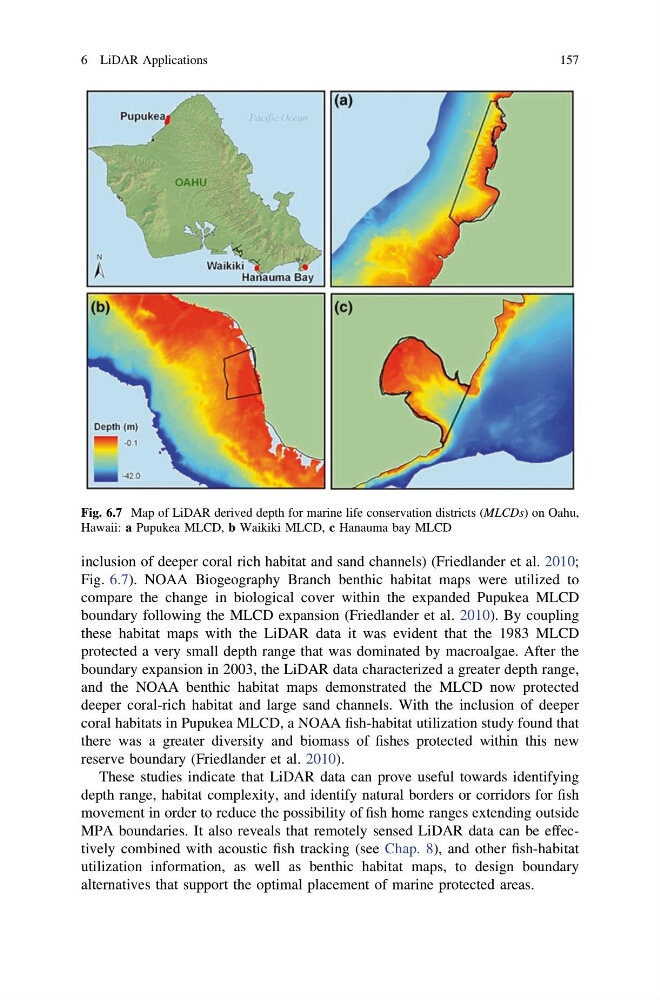
inclusion of deeper coral rich habitat and sand channels) (Friedlander et al. 2010;
Fig. 6.7). NOAA Biogeography Branch benthic habitat maps were utilized to
compare the change in biological cover within the expanded Pupukea MLCD
boundary following the MLCD expansion (Friedlander et al. 2010). By coupling
these habitat maps with the LiDAR data it was evident that the 1983 MLCD
protected a very small depth range that was dominated by macroalgae. After the
boundary expansion in 2003, the LiDAR data characterized a greater depth range,
and the NOAA benthic habitat maps demonstrated the MLCD now protected
deeper coral-rich habitat and large sand channels. With the inclusion of deeper
coral habitats in Pupukea MLCD, a NOAA fish-habitat utilization study found that
there was a greater diversity and biomass of fishes protected within this new
reserve boundary (Friedlander et al. 2010).
These studies indicate that LiDAR data can prove useful towards identifying
depth range, habitat complexity, and identify natural borders or corridors for fish
movement in order to reduce the possibility of fish home ranges extending outside
MPA boundaries. It also reveals that remotely sensed LiDAR data can be effectively combined with acoustic fish tracking (see Chap. 8), and other fish-habitat
utilization information, as well as benthic habitat maps, to design boundary
alternatives that support the optimal placement of marine protected areas.
Fig. 6.7 Map of LiDAR derived depth for marine life conservation districts (MLCDs) on Oahu,
Hawaii: a Pupukea MLCD, b Waikiki MLCD, c Hanauma bay MLCD
6 LiDAR Applications
157
Fig. 6.7). NOAA Biogeography Branch benthic habitat maps were utilized to
compare the change in biological cover within the expanded Pupukea MLCD
boundary following the MLCD expansion (Friedlander et al. 2010). By coupling
these habitat maps with the LiDAR data it was evident that the 1983 MLCD
protected a very small depth range that was dominated by macroalgae. After the
boundary expansion in 2003, the LiDAR data characterized a greater depth range,
and the NOAA benthic habitat maps demonstrated the MLCD now protected
deeper coral-rich habitat and large sand channels. With the inclusion of deeper
coral habitats in Pupukea MLCD, a NOAA fish-habitat utilization study found that
there was a greater diversity and biomass of fishes protected within this new
reserve boundary (Friedlander et al. 2010).
These studies indicate that LiDAR data can prove useful towards identifying
depth range, habitat complexity, and identify natural borders or corridors for fish
movement in order to reduce the possibility of fish home ranges extending outside
MPA boundaries. It also reveals that remotely sensed LiDAR data can be effectively combined with acoustic fish tracking (see Chap. 8), and other fish-habitat
utilization information, as well as benthic habitat maps, to design boundary
alternatives that support the optimal placement of marine protected areas.
Fig. 6.7 Map of LiDAR derived depth for marine life conservation districts (MLCDs) on Oahu,
Hawaii: a Pupukea MLCD, b Waikiki MLCD, c Hanauma bay MLCD
6 LiDAR Applications
157