

and habitat complexity, and mosaic of interconnected habitat types present in the
MPA. The application of LiDAR was then expanded in Hawaii to assist NOAA in
the evaluation of MPAs throughout the State (Friedlander et al. 2010). LiDAR data
was used to spatially characterize and quantify the three-dimensional seafloor
structure within each MPA (Friedlander et al. 2010). Here we highlight the results
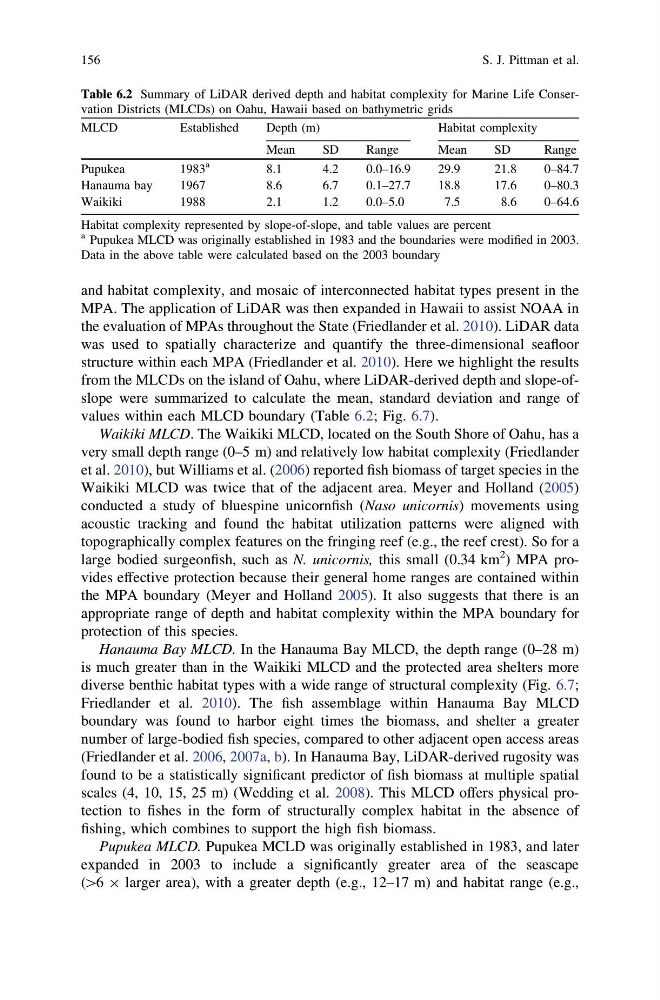
from the MLCDs on the island of Oahu, where LiDAR-derived depth and slope-ofslope were summarized to calculate the mean, standard deviation and range of
values within each MLCD boundary (Table 6.2; Fig. 6.7).
Waikiki MLCD. The Waikiki MLCD, located on the South Shore of Oahu, has a
very small depth range (0–5 m) and relatively low habitat complexity (Friedlander
et al. 2010), but Williams et al. (2006) reported fish biomass of target species in the
Waikiki MLCD was twice that of the adjacent area. Meyer and Holland (2005)
conducted a study of bluespine unicornfish (Naso unicornis) movements using
acoustic tracking and found the habitat utilization patterns were aligned with
topographically complex features on the fringing reef (e.g., the reef crest). So for a
large bodied surgeonfish, such as N. unicornis, this small (0.34 km
2 ) MPA provides effective protection because their general home ranges are contained within
the MPA boundary (Meyer and Holland 2005). It also suggests that there is an
appropriate range of depth and habitat complexity within the MPA boundary for
protection of this species.
Hanauma Bay MLCD. In the Hanauma Bay MLCD, the depth range (0–28 m)
is much greater than in the Waikiki MLCD and the protected area shelters more
diverse benthic habitat types with a wide range of structural complexity (Fig. 6.7;
Friedlander et al. 2010). The fish assemblage within Hanauma Bay MLCD
boundary was found to harbor eight times the biomass, and shelter a greater
number of large-bodied fish species, compared to other adjacent open access areas
(Friedlander et al. 2006, 2007a, b). In Hanauma Bay, LiDAR-derived rugosity was
found to be a statistically significant predictor of fish biomass at multiple spatial
scales (4, 10, 15, 25 m) (Wedding et al. 2008). This MLCD offers physical protection to fishes in the form of structurally complex habitat in the absence of
fishing, which combines to support the high fish biomass.
Pupukea MLCD. Pupukea MCLD was originally established in 1983, and later
expanded in 2003 to include a significantly greater area of the seascape
([6 9 larger area), with a greater depth (e.g., 12–17 m) and habitat range (e.g.,
Table 6.2 Summary of LiDAR derived depth and habitat complexity for Marine Life Conservation Districts (MLCDs) on Oahu, Hawaii based on bathymetric grids
MLCD
Established
Depth (m)
Habitat complexity
Mean
SD
Range
Mean
SD
Range
Pupukea
1983
a
8.1
4.2
0.0–16.9
29.9
21.8
0–84.7
Hanauma bay
1967
8.6
6.7
0.1–27.7
18.8
17.6
0–80.3
Waikiki
1988
2.1
1.2
0.0–5.0
7.5
8.6
0–64.6
Habitat complexity represented by slope-of-slope, and table values are percent
a Pupukea MLCD was originally established in 1983 and the boundaries were modified in 2003.
Data in the above table were calculated based on the 2003 boundary
156
S. J. Pittman et al.
MPA. The application of LiDAR was then expanded in Hawaii to assist NOAA in
the evaluation of MPAs throughout the State (Friedlander et al. 2010). LiDAR data
was used to spatially characterize and quantify the three-dimensional seafloor
structure within each MPA (Friedlander et al. 2010). Here we highlight the results
from the MLCDs on the island of Oahu, where LiDAR-derived depth and slope-ofslope were summarized to calculate the mean, standard deviation and range of
values within each MLCD boundary (Table 6.2; Fig. 6.7).
Waikiki MLCD. The Waikiki MLCD, located on the South Shore of Oahu, has a
very small depth range (0–5 m) and relatively low habitat complexity (Friedlander
et al. 2010), but Williams et al. (2006) reported fish biomass of target species in the
Waikiki MLCD was twice that of the adjacent area. Meyer and Holland (2005)
conducted a study of bluespine unicornfish (Naso unicornis) movements using
acoustic tracking and found the habitat utilization patterns were aligned with
topographically complex features on the fringing reef (e.g., the reef crest). So for a
large bodied surgeonfish, such as N. unicornis, this small (0.34 km
2 ) MPA provides effective protection because their general home ranges are contained within
the MPA boundary (Meyer and Holland 2005). It also suggests that there is an
appropriate range of depth and habitat complexity within the MPA boundary for
protection of this species.
Hanauma Bay MLCD. In the Hanauma Bay MLCD, the depth range (0–28 m)
is much greater than in the Waikiki MLCD and the protected area shelters more
diverse benthic habitat types with a wide range of structural complexity (Fig. 6.7;
Friedlander et al. 2010). The fish assemblage within Hanauma Bay MLCD
boundary was found to harbor eight times the biomass, and shelter a greater
number of large-bodied fish species, compared to other adjacent open access areas
(Friedlander et al. 2006, 2007a, b). In Hanauma Bay, LiDAR-derived rugosity was
found to be a statistically significant predictor of fish biomass at multiple spatial
scales (4, 10, 15, 25 m) (Wedding et al. 2008). This MLCD offers physical protection to fishes in the form of structurally complex habitat in the absence of
fishing, which combines to support the high fish biomass.
Pupukea MLCD. Pupukea MCLD was originally established in 1983, and later
expanded in 2003 to include a significantly greater area of the seascape
([6 9 larger area), with a greater depth (e.g., 12–17 m) and habitat range (e.g.,
Table 6.2 Summary of LiDAR derived depth and habitat complexity for Marine Life Conservation Districts (MLCDs) on Oahu, Hawaii based on bathymetric grids
MLCD
Established
Depth (m)
Habitat complexity
Mean
SD
Range
Mean
SD
Range
Pupukea
1983
a
8.1
4.2
0.0–16.9
29.9
21.8
0–84.7
Hanauma bay
1967
8.6
6.7
0.1–27.7
18.8
17.6
0–80.3
Waikiki
1988
2.1
1.2
0.0–5.0
7.5
8.6
0–64.6
Habitat complexity represented by slope-of-slope, and table values are percent
a Pupukea MLCD was originally established in 1983 and the boundaries were modified in 2003.
Data in the above table were calculated based on the 2003 boundary
156
S. J. Pittman et al.